FACULTYSURVEY - PTFEE
1. DEMOGRAPHICS
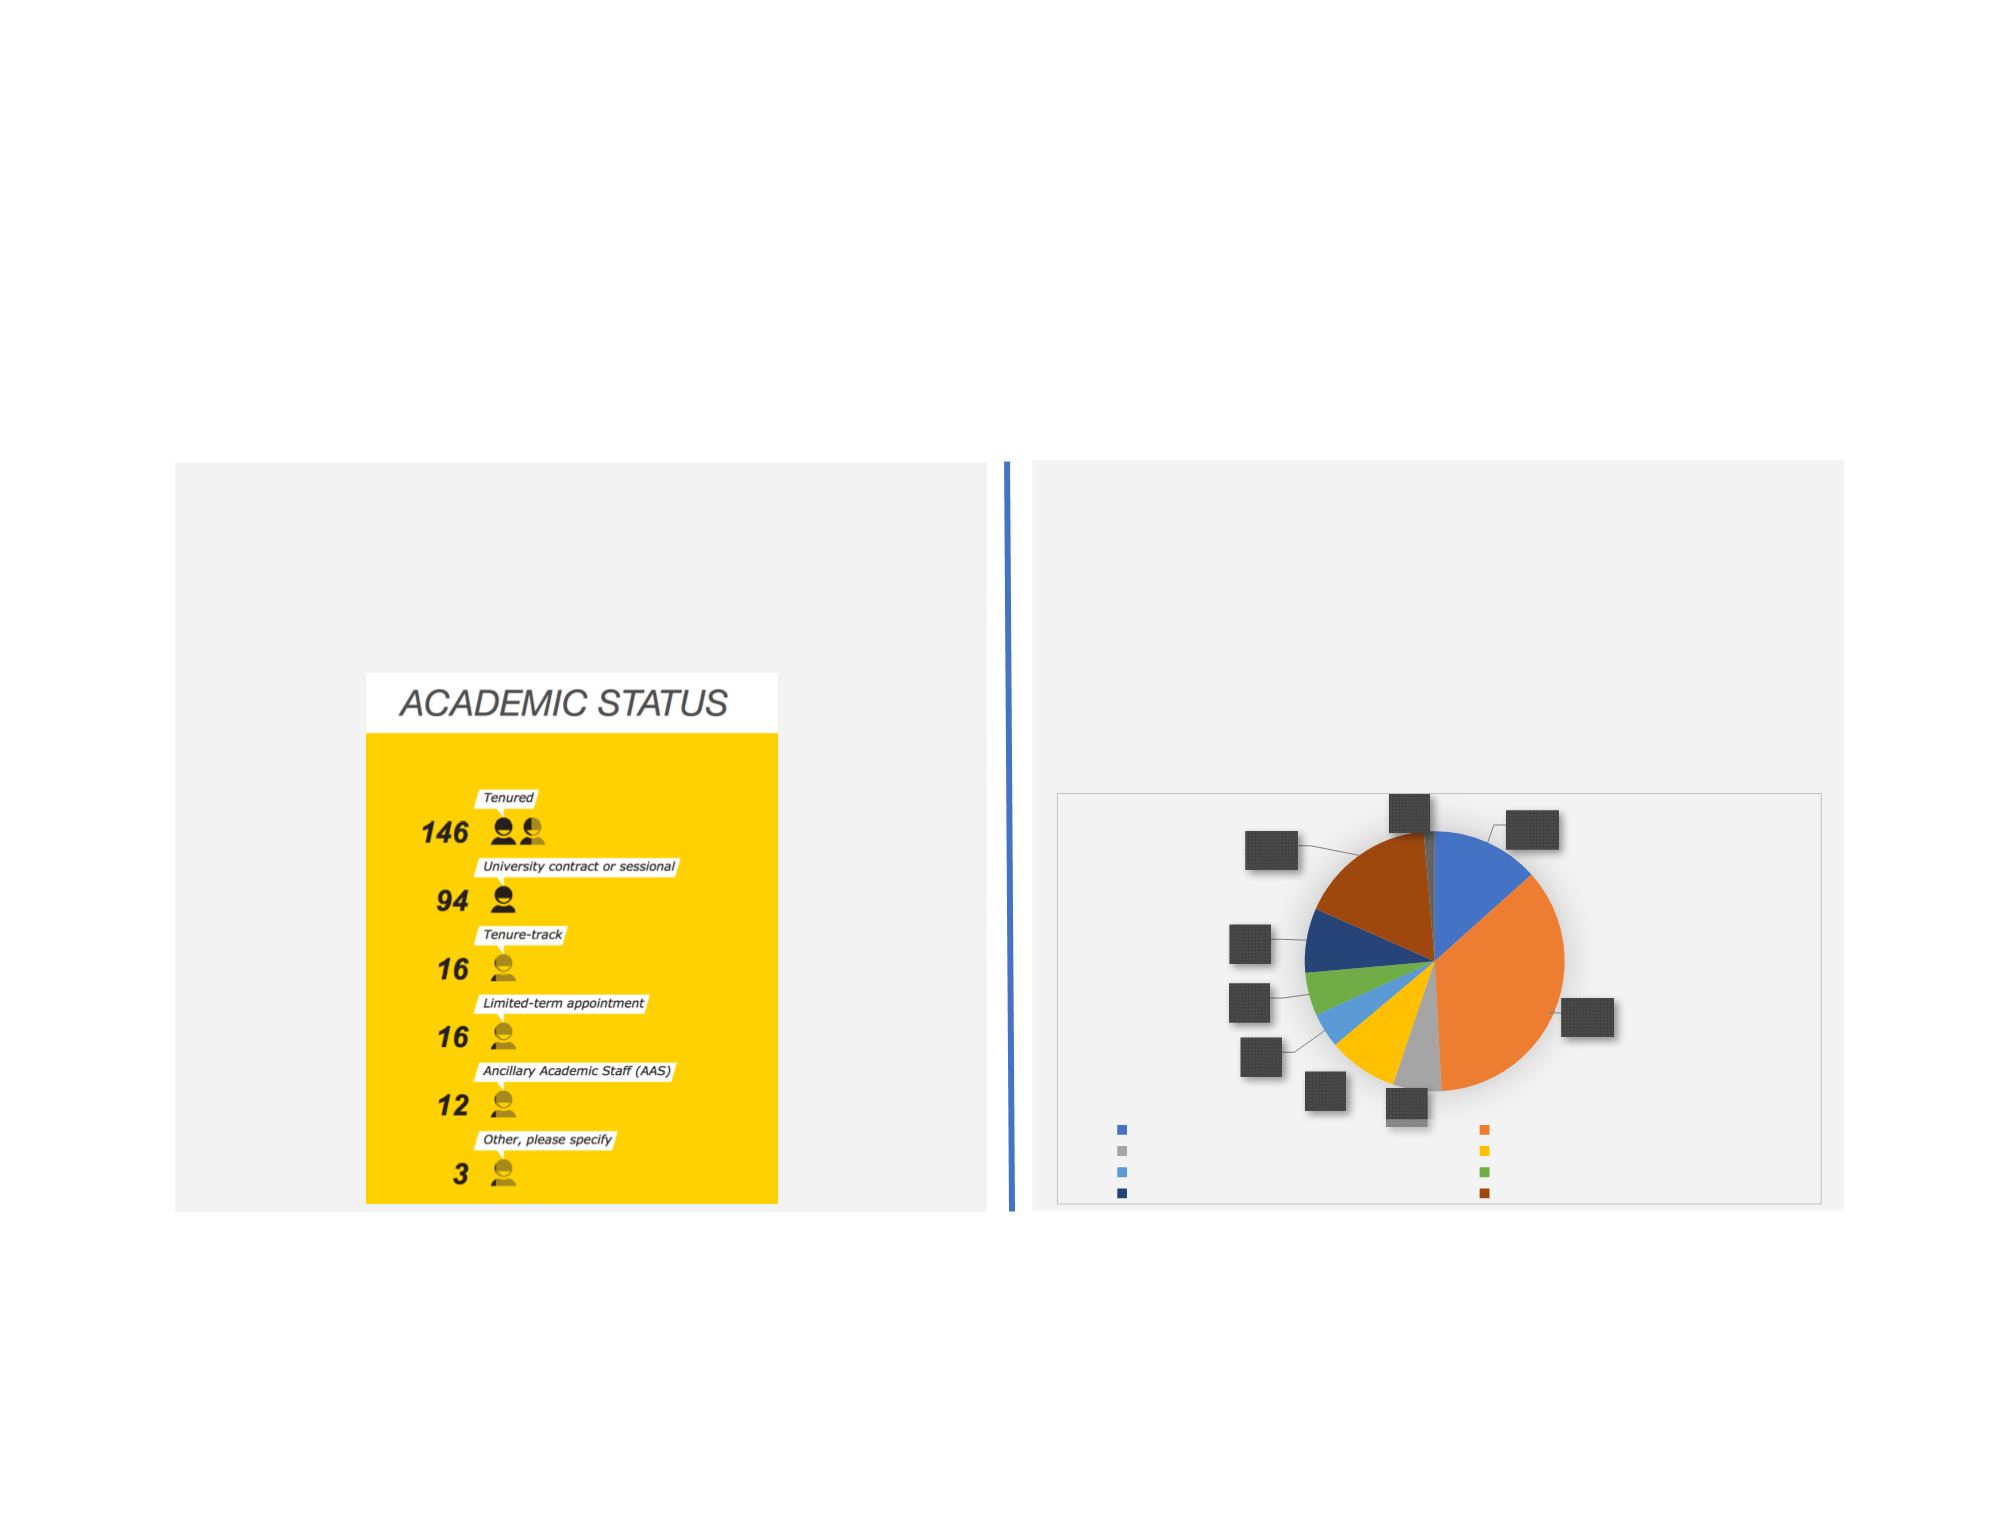
Surveywas fully completedby271 individuals andwhohad
taught oneormoreclasses sinceFall 2015 (seeFigure1).
Respondentsprimary consistedof tenuredor tenure-track
faculty (54.2%).
Figure1:
14%
36%
6%
9%
4%
5%
8%
17%
1%
BusinessAdministration
Arts, Humanities, andSocial Sciences
Education
Engineering
HumanKinetics
Law
Nursing
Science
Figure2:
Respondents reflectedall faculties. Largest proportionof
respondents associated themselveswithprogramming
offeredbyAHSS (n=107, 36%), followedbyScience (n=51,
17%), andBusiness (n=40, 14%).


