 |
|
|
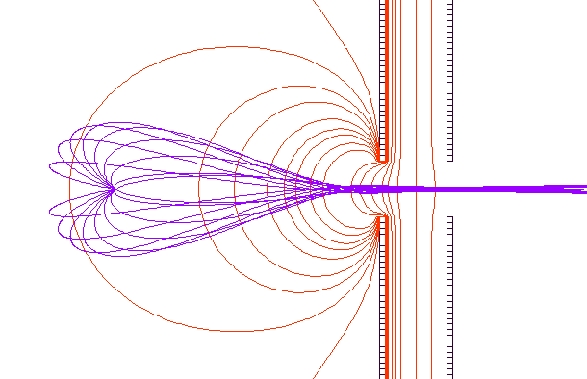
The efficient detection of "zero" energy electrons can be achieved using
the field-penetration technique1 , which is demonstrated in
figure 1. The figure shows how trajectories of 0.001eV electrons emitted
over 4-pi steradians from a point source can be focused and collimated
by the weak electric field from an extractor electrode that penetrates
through the 0 Volt aperture. The solid angle of extracted, faster electrons
is significantly smaller than for these "threshold" electrons and rapidly
diminishes with electron energy. This highly-efficient, energy selective
extraction allows one to perform 'threshold electron spectroscopy.
| Figure 1.
Diagram of the electric field contours and electron trajectories of "threshold" electrons in the field-penetration technique. |
|
 |
We have operated the toroidal analyser spectrometer in the threshold detection mode for spectroscopic studies of the rare gases2,3,4. Below are two figures (and references) that illustrate the senstivity of the threshold detection technique. As the energy selectivity, which depends on the electric field geometry, can give <5meV resolution, the threshold peaks in the figures have widths that are dominated by the spread in the photon beam energy. This technique is not only an accurate photon energy calibration method, but provides useful insight into electron correlation processes associated with ionic and (neutral) resonance state formation.
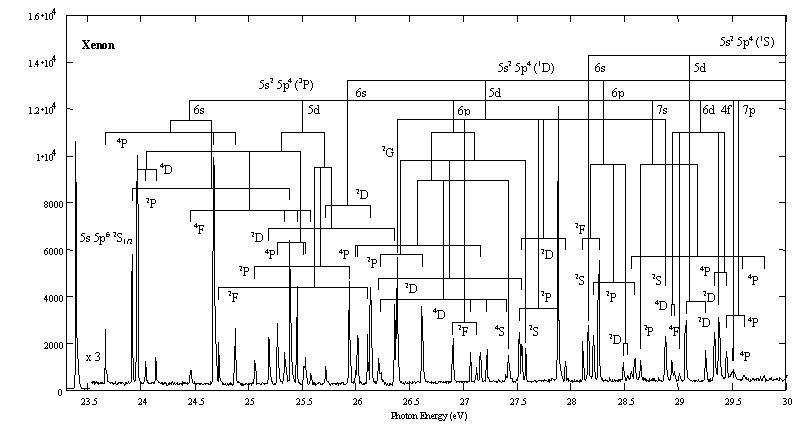
Figure 2. The threshold photoelectron spectrum of Xenon4 in the 23.5-29.5eV range with a measured overall resolution of ~13meV (FWHM). The system of assignment lines shows schematically the building of 'satellite' state configurations, starting with the three Xe++ 5p4 core configurations and attaching the excited electron to one of the free orbitals. Virtually all the J-components are observed and identified.
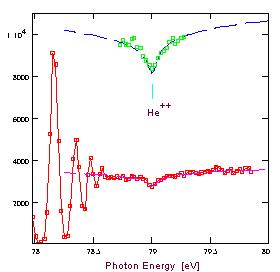
Figure 3. The threshold photoelectron spectrum of helium3
showing the characteristic cusp feature at the double ionisation threshold
energy, which Fano interpreted as the manifestation of the formation
and decay of electron correlations. The insert shows the improved
statistical accuracy when a number of spectra taken over the shorter region
of 0.6 eV around the double ionisation threshold are added to the
longer spectrum. The solid curve has an energy dependence given by the
Wannier exponent both above and below the threshold energy, convoluted
with a Gaussian profile of 70meV (FWHM) as the resolution is dominated
by that of the photon beam.
1 Cvejanovic and Read J. Phys. B.: At. Mol. Opt. Phys. (1974) 7 p1180
2 Cvejanovic et al J. Phys. B.: At. Mol. Opt. Phys. (1994) 27 p5661
3 Cvejanovic et al J. Phys. B.: At. Mol. Opt. Phys. (1995) 28 L707
4 Slattery et al J. Phys. B: At. Mol. Opt. Phys. (2000) 33 4833