 |
|
|
In general, the emission pattern of photoelectrons is not isotropic
in space, but produces a characteristic angular distribution. In the case
of gas-phase (single) photoionisation using linearly polarised light, this
differential cross section is expressed in terms of an asymmetry or b
parameter:
 |
where A is proportional to the photoionisation cross section for a particular
ionic state, E is the photon energy, P is the degree of linear polarisation,
and q is the angle between the polarisation
axis and the direction of the ejected electron. The variation of b
with photon energy depends on the interference of the partial waves which
contribute to the final channel and is therefore a sensitive probe of the
photoionisation dynamics. The energy variation in is generally gradual
and b lies within the range 2 to -1, the limits
corresponding to cos2q and sin2q
distributions respectively. However, at certain photon energies, photoionisation
can also occur indirectly via intermediate neutral states. It is well known
that the interference between the two
routes to ionisation can give rise to dramatic changes in both the partial
cross section and the angular distribution of the photoelectrons in the
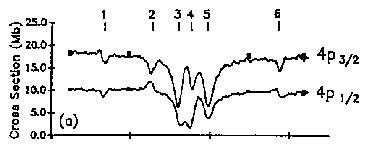
vicinity of 'resonance' states - see figure 1. Therefore measurements of
the differential cross sections for all possible decay channels are needed
to provide a comprehensive picture of resonance photoionisation process.
| Figure 1
Partial cross sections and b parameter measurements of the krypton 42P1/2 and 42P3/2 states at 14.000 and 14.665eV, respectively, from Flemming et al, Phys Rev A 44 (1991) 1733. The pronounced destructive interference between the direct and resonance excitation between 24.8-25.0eV is most evident in both channels, and the corresponding rapid fluctuations in the b parameter are also apparent. Six resonance states (see upper figure) have been identified in this photon energy region. |
 |
Traditionally, a photoelectron spectrometer is used to measure the count
rates
at q = 0oand 90o; their
ratio is used to derive b(E). However, one fixed
analyser can be used which disperses the electrons in energy, yet preserves
the angle of emission. Two such systems are cylindrical mirror and toroidal
analysers whose axial symmetry allows a 360o field of view of
the interaction region. This property of CMAs and toroidal analysers is
well known and enables one to measure energy-resolved angular distributions
using position-sensitive detectors. Recently, we have demonstrated how
b parameters can be determined accurately using
a toroidal spectrometer with
a position-sensitive detectors in the angle-dispersive plane. The multi-angle
detection facility of the system greatly enhances the detection efficiency,
allowing the option of higher photon energy resolution or polarisation
than ordinarily possible. Furthermore, the data collection procedures generally
have fixed accumulation times for each energy and angle, resulting in large
errors at small count rates. Such regions of low cross section are often
the most interesting in terms of rapid variations in b(E)
(e.g. window resonances in rare gases - see Figure 1) so the reduction
in statistical accuracy is a significant disadvantage. In our technique,
a fixed number of counts - covering a wide range (~140o)
of emission angles - were accumulated at each photon energy. (A
resistive anode encoder lends itself to this data accumulation method as
it counts events one-at-a-time across its whole active area.) The accuracy
of the measurement method is therefore independent of count rate
and variations in the photon flux. However, the accumulation time and
photon flux are also recorded at each photon energy so that the count rate
(cross section) can be recovered later if required. Thus this method is
primarily one for measuring angular distributions, whereas conventional
approaches generally determine count rates at each angle.
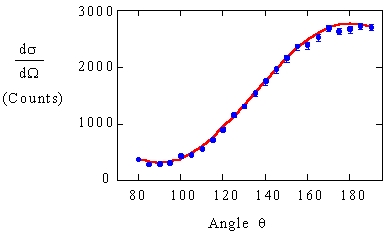
| In this case the detector efficiency (as a function of angle) was calibrated
using known b in flat part of spectrum (eg.
25.25eV), and then applied at all the other photon energies. Then the b
parameter variation was determined by fitting the equation to each recorded
image using fixed polarisation (P = 0.9) - a typical image and its fit
is shown (right) and the final spectra are shown and discussed in Figure
2.
Full details can be found in:
|
 |
 |
 |
 |
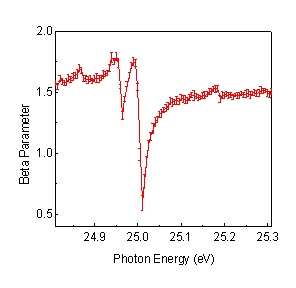 |
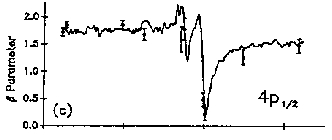
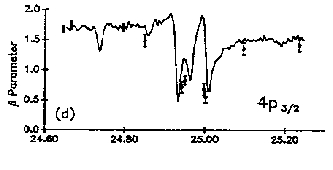
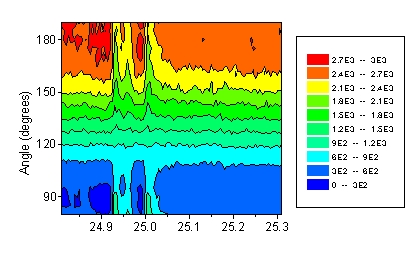
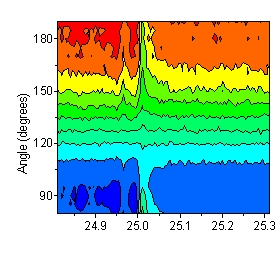
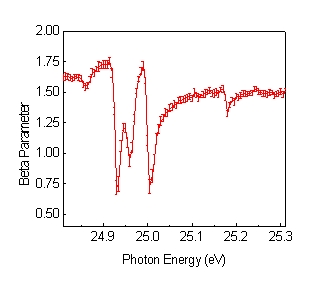
Figure 2. Upper figures show the contour plots of the measured
angular distributions for the and 42P3/2 (left) and
42P1/2 (right) states of krypton in the photon energy
region covering the lowest 'window' resonances. They have the same intensity
scale as a fixed number of points per energy were recorded, regardless
of changes in the cross sections - as discussed in the text. The b
parameter spectra derived from the surface plots are also shown and can
be compared to those in figure 1. Although the overall agreement is excellent,
the slight difference in the vertical scale is probably due to the choice/accuracy
of polarisation value used in both data sets. The near constancy of the
statistical error bars as a function of b is
due to the new data collection procedure. In particular, this method is
more reliable over conventional methods for distinguishing small variations
in b upon a large b
background.