Detroit River-Western Lake Erie Basin Indicator Project
Phosphorus Loads and Concentrations from the Maumee River
Authors
Nate Manning, National Center for Water Quality Research, Heidelberg College, nmanning@heidelberg,eduLaura Johnson, National Center for Water Quality Research, Heidelberg College, ljohnso1@heidelberg,edu
Background
Lake Erie (Figure 1) is a classic case of development, recovery from, and return to eutrophication, hypoxia, and HABs. Substantial increases in nutrient loading from agricultural, industrial, and urban sources in the mid-20th century led to severe water quality degradation in the 1960’s (Rosa and Burns, 1987; Bertram, 1993; Makarewicz et al., 1989). These highly publicized problems ultimately led the governments of the United States and Canada to shape a Great Lakes Water Quality Agreement (GLWQA 1978) with a focus on phosphorus (P) load reduction. The subsequent P abatement programs led to a relatively quick recovery (DePinto et al., 1986a) as indicated by decreases in total phosphorus (TP) loads (Dolan, 1993), water column TP concentrations (DePinto et al., 1986a; Ludsin et al., 2001), phytoplankton biomass (especially western basin cyanobacteria), and central basin bottom-water hypoxia (Makarewicz and Bertram, 1991; Bertram, 1993; Charlton et al., 1993), as well as by recovery of several ecologically and economically important fishes (Ludsin et al., 2001).
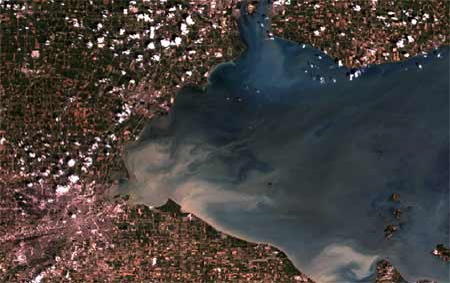
Figure 1. Sediment loading from the Maumee River originating from agricultural nonpoint source inputs (Photo credit: NASA Landsat Program).
These improvements were relatively short lived, however, because hypoxia and HAB biomass began to increase during the 1990s (Scavia et al., 2014). There has been a return of extensive central basin hypoxia (Burns et al., 2005; Zhou et al., 2013; Rucinski et al., 2014) and increases in cyanobacteria blooms in the western basin (e.g. Microcystis spp. and Lyngbya wollei) (Bridgeman et al., 2012; Stumpf et al., 2012; Michalak et al., 2013), with record blooms set in 2011 (Michalak et al., 2013) and 2015, and a bloom in 2014 that led to a “do not drink” advisory for 400,000 people living in the Toledo, Ohio area.
This degradation in water quality prompted the U.S. and Canada to revise the GLWQA and set new P load reduction targets (GLWQA 2016). It was concluded that non-point source runoff from the Maumee River during the spring period of 1 March to 31 July each year was the best predictor of cyanobacteria bloom severity and so to achieve a bloom no greater than that observed in 2004 or 2012, 90% of the time, new Maumee River spring loading targets were set for total phosphorus (TP) (860 metric tons) and dissolved reactive phosphorus (DRP) (186 metric tons). This 860 metric ton target is approximately a 40% reduction from the 2008 spring load of 1,400 metric tons for TP and 310 metric tons of DRP. Furthermore, in order to reduce Central Basin hypoxia and achieve an August – September average hypolimnetic oxygen concentration of 2 mg/L or more, annual TP load to the western and central basins should not exceed 6,000 MT annually. This reduction corresponds to a 40% annual TP reduction relative to 2008 of all loads, which includes the Maumee River. The Ohio Domestic Action Plan to achieve these reductions has calculated the Maumee River target annual TP load as 2,287 metric tons.
The Maumee River is the largest tributary to Lake Erie. Its watershed of more than 16,835 square kilometers (6,500 square miles) is located mostly in northwest Ohio, with smaller portions in eastern Indiana and southern Michigan. Water from the Maumee River enters Lake Erie's western basin at Toledo. The Maumee River is also the single largest source of phosphorus loading to Lake Erie, with the majority of the load coming from agriculture. More than 80% of the watershed is devoted to agricultural land uses. For more information about the Maumee River watershed (Richards et al., 2002a).
The National Center for Water Quality Research (NCWQR) at Heidelberg University in Tiffin, Ohio has been monitoring water quality in the Maumee River since 1975. The sampling station is located at the Bowling Green drinking water intake, near the USGS gaging station at Waterville, Ohio. Three samples per day are collected by an automatic sampler. The samples are collected weekly and returned to the Center's Water Quality Laboratory for analysis. During periods of low flow, one sample per day is analyzed; at other times, all three samples are analyzed. This program produces about 425 samples per year and provides the most detailed data for nutrient load determination available anywhere in the Great Lakes (www.ncwqr.org). Previous studies of water quality trends in the Maumee River are included in Richards (2006), Stow et al., (2015), Jarvie et al., (2017) and Choquette et al., (2019).
Status and Trends
Total Phosphorus
Annual loads of TP from the Maumee River are shown in Figure 2. There is a gap in the graph because of a lack of funding during 1979-1981. Inter-annual variation in loads is high across the entire period of record, due to the influence of weather events. The slight downward trend in the data is not significant (p= 0.248). On average during this time, the Maumee River annual load to Lake Erie is about 19% of the estimated total annual load from all sources.
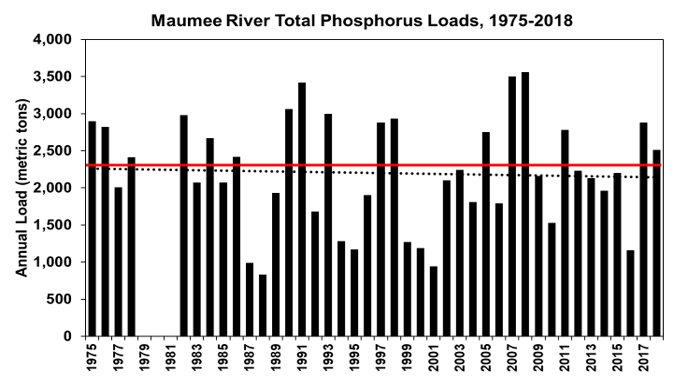
Figure 2. Total phosphorus loads in the Maumee River at Waterville, 1975-2018. The downward trend is not statistically significant. The red line is the Ohio Domestic Action Plan Target of 2287 metric tons annually.
As with the annual TP load, spring loads display a large amount of inter-annual variation, and while the long-term trend is negative, it is not statistically significant (p= 0.137) (Figure 3). When compared to the target spring TP load set by the GLWQA, the Maumee River has exceeded the target in 13 out of 18 years since 2000, with 2011, 2015 and 2017 attaining levels not seen since the early 1980’s.
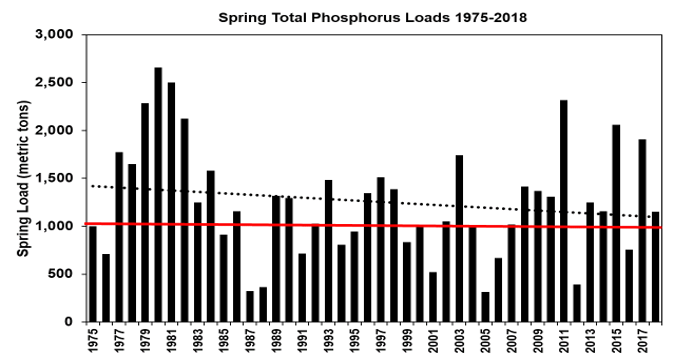
Figure 3. Spring (March 1 to July 31) total phosphorus loads from the Maumee River from 1975-2018 water years. The red line represents the GLWQA spring loading target for TP (860 metric tons).
Dissolved Reactive Phosphorus
Dissolved reactive phosphorus (DRP) is that portion of total phosphorus that is readily available for algal and other plant growth. Typically, about 10-30% of TP in the Maumee is DRP. DRP in the Maumee River decreased from the mid-1970s until the late 1980s, and has since seen an increase of more than 200% (Figure 4). The increase in DRP loads to the western basin of Lake Erie from the Maumee River is significant (p=0.0002) and in multiple years has exceeded those recoded in the 1970s.
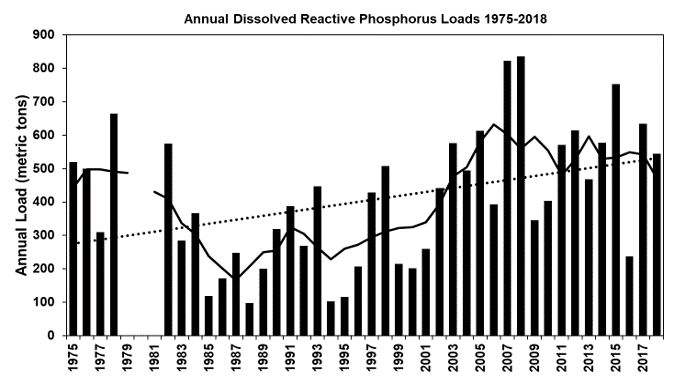
Figure 4. Annual dissolved reactive phosphorus loads in the Maumee River at Waterville, 1975-2018 water years. The positive trend is significant (p<0.001). The solid line is the five-year running average, showing the u-shaped pattern in the data.
The spring DRP loads from the Maumee River show a pattern similar to that of the annual loads, with decreasing loads through the 1980s, and then a steady increase, with levels peaking in 2015, coinciding with the largest harmful algal bloom recorded in Lake Erie (Figure 5). While the long-term (1975-2018) trend is not significant (p=0.313), since 1990, the trend is positive (+271%) and significant (p=0.0016). As with TP, DRP spring loads exceeded the Great Lakes Water Quality Agreement target for the Maumee in most years, particularly since 2000, with 2015 having the highest DRP loads since monitoring began.
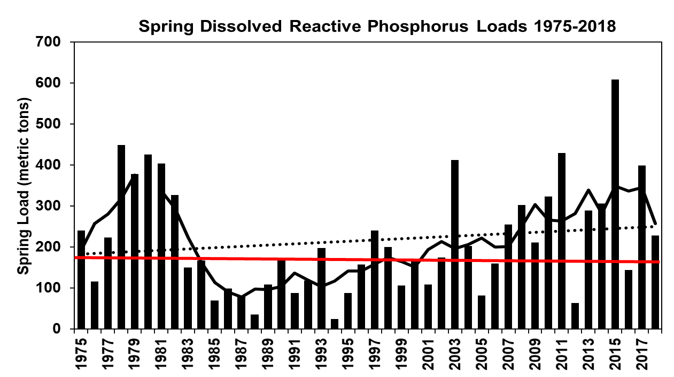
Figure 5. Spring dissolved reactive phosphorus loads from the Maumee River. The solid black line is the five-year running average, showing the u-shaped pattern in the data. The red line represents the Great Lakes Water Quality Agreement spring loading target for DRP (186 metric tons).
Flow-Weighted Mean Concentrations
Total Phosphorus
Although annual and spring phosphorus loads are the measure by which we evaluate success in managing inputs to Lake Erie, important information can also be obtained by examining trends in flow-weighted mean concentrations (FWMCs) of total phosphorus and of other forms of phosphorus. The FWMC is calculated as the load divided by the discharge. Interannual variation is much lower in FWMC because it is not as heavily influenced by changes in discharge, thus making it easier to assess long-term trends especially in very wet or dry periods. Over the period of record, annual TP FWMCs decrease by 21% (Figure 6), which is a larger decrease than the annual TP loading (Figure 2), but this decrease is also not significant (p=0.161). The spring TP FWMC did significantly decrease (24%, p=0.0003) over the period of record (Figure 7), however, this relationship is driven by the decrease in loads prior to 1990. Since 1990, the relationship is flat, with no significant trend (p=0.271).
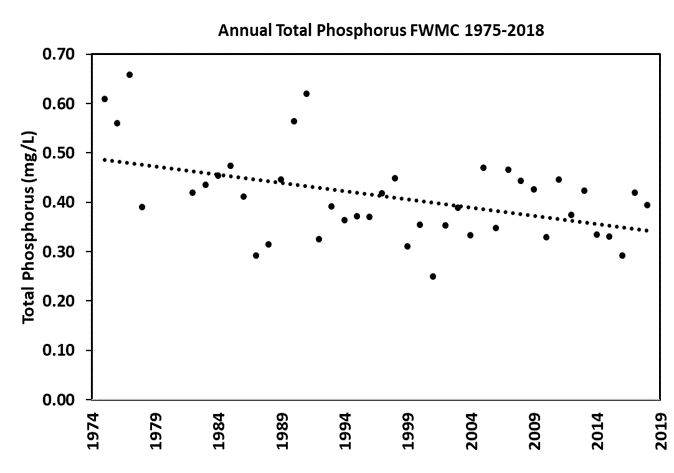
Figure 6. Total phosphorus annual flow-weighted mean concentrations for the Maumee River at Waterville, 1975-2017.
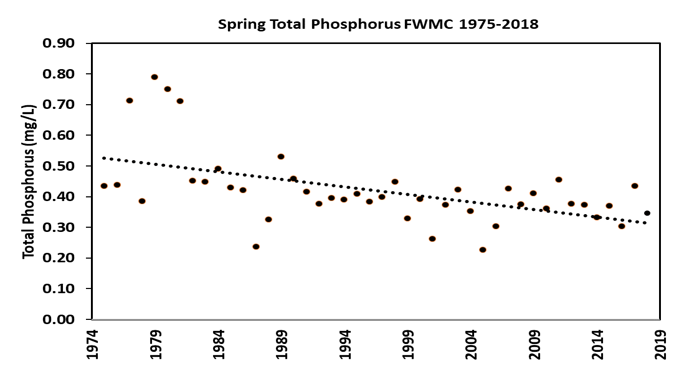
Figure 7. Total phosphorus spring flow-weighted mean concentrations for the Maumee River at Waterville, 1975-2017.
Annual DRP FWMCs (Figure 8) decreased by 57% between the early 1970s and early 1990s, and then increased 52% between 2000 and 2018. The spring DRP FWMC shows a similar pattern to the annual FWMC, with significant decreases from the 1970s into the mid 1990s, and then an increase to levels similar to the 1970s by the early 2010s (Figure 9). The percentage of TP that is DRP has increased over the last 20 years, with levels regularly exceeding 25%, well above what was seen in the 1970’s through the 1990’s (Figure 10).
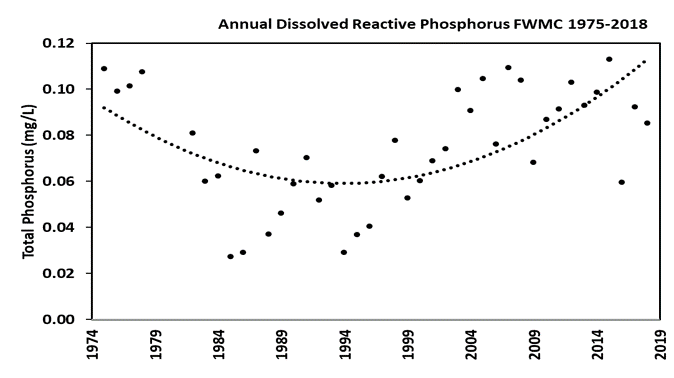
Figure 8. Dissolved reactive phosphorus annual flow weighted mean concentrations for the Maumee River at Waterville, 1975-2018 water years. The parabolic trend is significant (p=0.0021).
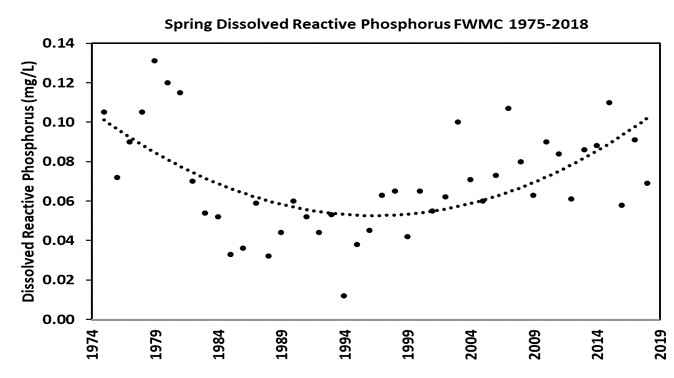
Figure 9. Dissolved reactive phosphorus spring flow weighted mean concentrations for the Maumee River at Waterville, 1975-2018 water years. The parabolic trend is significant (p=0.0117).
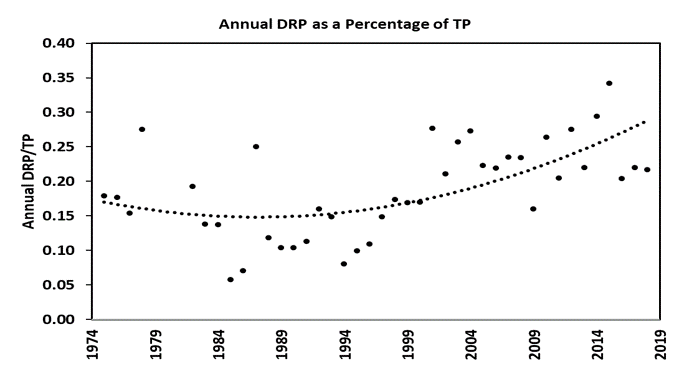
Figure 10. Dissolved reactive phosphorus as a percent of total phosphorus, annual values for the Maumee River at Waterville, 1975-2018. The parabolic trend is significant and represents a decrease of 35% followed by an increase from the minimum of 92%.
Trends in phosphorus loading from the Maumee River are troubling. While TP loads and FWMCs were flat, or decreasing slightly over the long term, they were still often well above the target levels set by the amendments to the Great Lakes Water Quality Agreement and the Ohio Domestic Action Plan. Dissolved reactive phosphorus is of particular concern, as its loads and FWMCs have increased in recent years, and the increases in DRP are linked to increased harmful algal blooms in the western basin and hypoxia in the central basin of Lake Erie. The increasing contribution of nonpoint sources, such as agriculture and urban runoff are likely driving this increased DRP loading, but the mechanisms behind it are not yet well understood. The current loading targets may need to be amended in the future to account for the increasing bio-availability of phosphorus that enters Lake Erie.
Research/Monitoring Needs
Research is needed to determine the cause or causes of increased dissolved reactive phosphorus in the Lake Erie tributaries, however there are a number of challenges associated with reducing DRP exports from the Maumee watershed. These include (from Baker et al., 2019):
- The large loads of DRP moving from cropland through the Maumee River to the western basin represent the cumulative effects of many small DRP losses at the field scale. As such, these losses are of little economic concern for individual farmers.
- Subsurface drainage via tile systems is an essential component of crop production in much of the Maumee watershed. Recent research has confirmed that these tile systems represent major pathways for DRP export from cropland. Because of their economic benefits to farmers, intensification of these tile drainage systems is continuing, resulting in increased water yields from cropland, greater connectivity between cropland and stream systems, and increased DRP runoff.
- Utilization of no-till and reduced till cropping systems offer economic advantages to farmers, as well as erosion control benefits. These systems are often accompanied by increased runoff concentrations and loads of DRP because of a build-up of phosphorus soil test levels in the upper layers of the soil and development of soil macropores, which support preferential flow of water from the surface to tile systems. In part, increased DRP runoff is an unintended consequence of erosion control practices aimed at reducing particulate phosphorus loading.
- Winter cover crops, which are an integral part of the soil health movement and erosion control programs, can increase DRP runoff due to freeze-thaw breakdown of crop residues at the soil surface and related release of DRP.
- Past fertilizer application practices have increased the content of plant-available phosphorus in the soil such that current reserves, even when soil test levels are in the maintenance range, could sustain current crop yields for multiple years without addition of fertilizers. These legacy pools of phosphorus could sustain DRP runoff at current levels well into the future.
- Hydrology is a major driver of phosphorus runoff from cropland, as reflected in the large annual variability in DRP and TP export associated with stream discharge. Annual precipitation and spring discharge have significantly increased between 1966 and 2015. Climate change models predict that this region will see increased storm intensities and frequencies, such that DRP loading will increase, given current management practices.
Future Research Needs (from Wilson et al. 2018)
Identifying what and where BMPs are likely to be most effective requires a better understanding of:
- The combined influence of soil chemical and microbial activity on phosphorus dynamics. Specifically, how soil quality impacts water holding capacity, P loss, and water infiltration, as well as determining if reductions in P losses from breaking up soil P stratification by inversion tillage are outweighed by the damage to soil quality, specifically losses to water holding capacity, after tillage.
- The relationship between phosphorus stratification and preferential flow through tile drainage, the effectiveness of subsurface application of phosphorus, and how long subsurface application of phosphorus will take to be effective if applied in fields with existing phosphorus stratification.
- The impact of drainage water management on surface and tile flow of water and phosphorus.
- Nitrogen impacts on toxin production, and which practices might accomplish both nitrogen and dissolved phosphorus reductions.
- The spatial distribution and range of soil test phosphorus values, especially locations of fields with elevated phosphorus levels.
- The contribution of colloidal phosphorus to DRP measurements and whether colloidal phosphorus loss is controlled better by erosion mitigating BMPs or nutrient management.
- Clearer understanding of phosphorus cycling and dynamics at a variety of scales, including in-field, edge-of-field, and in-stream.
- The potential for in-stream processes to either contribute or reduce phosphorus (e.g., within the stream bed and from stream bank erosion) and if certain segments within rivers always contribute nutrients at the same rate or if that rate varies by time and/or stream condition (e.g., temperature, flood stage, etc.).
Management Next Steps
While significant efforts to manage the export of phosphorus from the Maumee River have been implemented in the last decade, the mechanisms driving the increasing trend in DRP are not well understood at this time. There is a growing body of evidence however that points to a number of management actions that could contribute to reductions in DRP. The largest reductions in DRP will be achieved through agricultural practices, such as:
- Soil test informed applications rates (i.e., following tri-state fertility guidelines and only applying phosphorus that is needed);
- Subsurface placement of fertilizers (e.g., banding, in-furrow with seed) to minimize enrichment of phosphorus in the surface layer of the soil, and especially in no-till agriculture, which reduces soil erosion by keeping crop and plant residues on the surface longer;
- Minimizing the amount of water leaving a field through a variety of practices such as drainage water management and improved soil water holding capacity.
- Improvements in the regulation and management of liquid manures from concentrated animal operations; Application of manure P based on agronomic need using tri-state fertility recommendations. Though other sources are a minor contribution relative to agricultural non-point sources, municipalities can reduce DRP by:
- Continued reductions in sewage treatment plant effluent concentrations to counter human population growth in the basin;
- Improvements in the functioning of home septic systems and small-scale treatment systems and elimination of direct connections of rural home septic systems into agricultural drain tiles and ditches;
- Improved management of urban nonpoint runoff.
References
- Bertram, P.E. 1993. Total phosphorus and dissolved oxygen trends in the central basin of Lake Erie, 1970–1991. Journal of Great Lakes Research. 19, 224–236.
- Bridgeman, T.B., Chaffin, J.D., Kane, D.D., Conroy, J.D., Panek, S.E. and Armenio, P.M., 2012. From River to Lake: Phosphorus partitioning and algal community compositional changes in Western Lake Erie. Journal of Great Lakes Research. 38(1), 90-97.
- Burns, N.M. Rockwell, D.C. Bertram, P.E. Dolan, D.M. Ciborowski, J.J.H. 2005. Trends in temperature, secchi depth, and dissolved oxygen depletion rates in the central basin of Lake Erie, 1983–2002. Journal of Great Lakes Research. 31 (Supplement 2), 35–49.
- Charlton, M.N. Milne, J.E. Booth, W.G. Chiocchio, F. 1993. Lake Erie offshore in 1990 — restoration and resilience in the central basin. Journal of Great Lakes Research. 19, 291–30.
- Choquette, A.F., Hirsch, R.M., Murphy, J.C., Johnson, L.T. and Confesor Jr, R.B., 2019. Tracking changes in nutrient delivery to western Lake Erie: Approaches to compensate for variability and trends in streamflow. Journal of Great Lakes Research, 45(1), pp.21-39.
- DePinto, J.V. Young, T.C.McIlroy, L.M. 1986. Impact of phosphorus control measures on water quality of the Great Lakes. Environmental Science and Technology. 20, 752–759.
- Great Lakes Water Quality Agreement. 1978. International Joint Commission, IJC, Great Lakes Water Quality Agreement of 1978 Agreement with Annexes and Terms of Reference, Between the United States of America and Canada. International Joint Commission, Windsor, Ontario.
- Great Lakes Water Quality Agreement. 2016. The United States and Canada adopt phosphorus load reduction targets to combat Lake Erie algal blooms. https://binational. net/2016/02/22/finalptargets-ciblesfinalesdep. Viewed 25 Feb 2016.
- Jarvie, H.P., Johnson, L.T., Sharpley, A.N., Smith, D.R., Baker, D.B., Bruulsema, T.W. and Confesor, R., 2017. Increased soluble phosphorus loads to Lake Erie: Unintended consequences of conservation practices?. Journal of Environmental Quality, 46(1), pp.123-132.
- Ludsin, S.A. Kershner, M.W. Blocksom, K.A. Knight, R.L. Stein, R.A. 2001. Life after death in Lake Erie: nutrient controls drive fish species richness, rehabilitation. Ecological Applications. 11, 731–746.
- Makarewicz, J.C. Bertram, P. 1991. Evidence for the restoration of the Lake Erie ecosystem. Bioscience. 41, 216–223.
- Michalak, A.M., Anderson, E.J., Beletsky, D., Boland, S., Bosch, N.S., Bridgeman, T.B., Chaffin, J.D., Cho, K., Confesor, R., Daloğlu, I. and DePinto, J.V., 2013. Record-setting algal bloom in Lake Erie caused by agricultural and meteorological trends consistent with expected future conditions. Proceedings of the National Academy of Sciences. p.201216006.
- Richards, R.P. 2006. Section 10.10. Trends in sediment and nutrients in major Lake Erie tributaries, 1975-2004. In Lake Erie Lakewide Management Plan 2006 Update.
- Richards, R.P., F.G. Calhoun, and G. Matisoff. 2002a. The Lake Erie Agricultural Systems for Environmental Quality project: An introduction. Journal of Environmental Quality 31:6-16.
- Richards, R.P., D.B. Baker, and D.J. Eckert. 2002b. Trends in agriculture in the LEASEQ watersheds, 1975-1995. Journal of Environmental Quality 31:17-24.
- Richards, R.P., and D.B. Baker. 2002. Trends in water quality in LEASEQ rivers and streams, 1975-1995. Journal of Environmental Quality 31:90-96.
- Rosa, F. and Burns, N.M., 1987. Lake Erie central basin oxygen depletion changes from 1929–1980. Journal of Great Lakes Research. 13(4), 684-696.
- Rucinski, D. Scavia, D. DePinto, J. Beletsky, D. 2014. Lake Erie's hypoxia response to nutrient loads and meteorological variability. Journal of Great Lakes Research. http://dx.doi.org/ 10.1016/j.jglr.2014.02.003
- Scavia, D. Allan, J.D. Arend, K.K. Bartell, S. Beletsky, D. Bosch, N.S.…, Zhou, Y. 2014. Assessing and addressing the re-eutrophication of Lake Erie: central basin hypoxia. Journal of Great Lakes Research. 40(2), 226–246.
- Stow, C.A., Cha, Y., Johnson, L.T., Confesor, R. and Richards, R.P., 2015. Long-term and seasonal trend decomposition of Maumee River nutrient inputs to western Lake Erie. Environmental science & technology, 49(6), pp.3392-3400.
- Stumpf, R.P. Wynne, T.T. Baker, D.B. Fahnenstiel, G.L. 2012. Interannual variability of cyanobacterial blooms in Lake Erie. PLoS One. 7, e42444
- Wilson, R.S., Beetstra, M.A., Reutter, J.M., Hesse, G., Fussell, K.M.D., Johnson, L.T., King, K.W., LaBarge, G.A., Martin, J.F. and Winslow, C., 2018. Commentary: Achieving phosphorus reduction targets for Lake Erie. Journal of Great Lakes Research.
- Zhou, Y. Obenour, D.R. Scavia, D. Johengen, T.H. Michalak, A.M. 2013. Spatial and temporal trends in Lake Erie hypoxia, 1987–2007. Environmental Science and Technology. 47, 899–905.