Detroit River-Western Lake Erie Basin Indicator Project
Analysis of Phosphorus Concentrations in the Western Basin of Lake Erie
Background
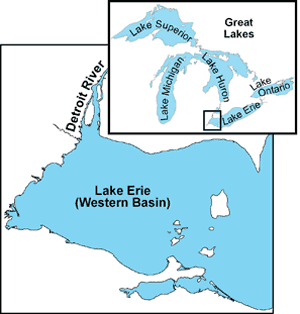
In the early 1970s it was widely recognized that areas of the Great Lakes, including the western basin of Lake Erie (Figure 1), had become nutrient enriched (eutrophic). These nutrient enriched areas supported excessive algal growth resulting in nuisance blooms and/or adverse effects on other components of the ecosystem. A series of research initiatives identified phosphorus as the primary nutrient limiting the growth of algae in the Great Lakes.

Figure 1. The Great Lakes and location of the western Lake Erie basin.
The Great Lakes Water Quality Agreements (GLWQA) of 1972 and 1978 recognized the damage caused by phosphorus pollution and the need for society to control phosphorus inputs. Therefore, the GLWQA included a binational phosphorus abatement program in order to restore the lakes to a more natural state. Due to the strong link between phosphorus and algal growth, ambient phosphorus concentrations and phosphorus loading are routinely used to evaluate the level of nutrient enrichment and overall ecosystem health of the Great Lakes.
Since 1976, as part of a monitoring program to track nutrient levels and trophic conditions in the nearshore areas of the Great Lakes, the Ontario Ministry of the Environment (MOE) has analyzed the untreated water from selected Great Lakes water treatment (drinking water) facilities for nutrients and other water quality parameters. The data record for the MOE Great Lakes intake biomonitoring program spans three decades, with an approximately weekly sampling interval. While the water intake datasets are extensive, the use of such data to track changes in water quality also has disadvantages. Because the intakes are typically located at a limited distance from the shoreline in relatively shallow water, there is an increased potential for localized nearshore influences on the collected data. For example, on the exposed shoreline of the Great Lakes, the wind-induced suspension of sediments can result in the periodic elevation of turbidity and suspended solids levels in samples derived from shallow water intakes that are not reflected in the offshore condition. Nevertheless, while using intake data to infer offshore or basin-wide conditions contains some elements of uncertainty, there is strong evidence that trends identified within the water intake data do reflect changes in water quality that have occurred within the nearshore and offshore environments.
The Union (Essex County) Water Treatment Plant is located 5-6 km west of Leamington, Ontario. It draws its source water from western Lake Erie and supplies potable water to the Municipality of Leamington (which includes the towns of Leamington, Kingsville, Essex, and Lakeshore). The water intake pipe is located approximately 0.46 km offshore and 1 meter above the lake bottom (Nicholls et al. 2001) in an area where the lake depth is approximately 4 meters.
Nutrients and other water quality parameters from untreated (raw) water at the Union Water Treatment Plant have been analyzed on an ongoing basis as part of the intake biomonitoring program since 1976. Water quality data collected at the Union Intake have been used to analyze the response of phytoplankton and nutrients in western Lake Erie to phosphorus control strategies, to the invasion of zebra mussels, to variation in weather patterns, and to changes in trophic interactions (Nicholls et al.1980; Nicholls and Hopkins 1993; Nicholls et al. 2001). Trends in total phosphorus concentrations from 1976 to 1999 in water collected at the Union plant, as well as 17 other intakes around the Great Lakes, were reported by Nicholls et al. (2001). Additional data for the years 2000 to 2004 are provided in the section below.
Status and Trends
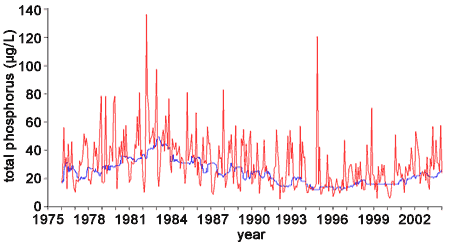
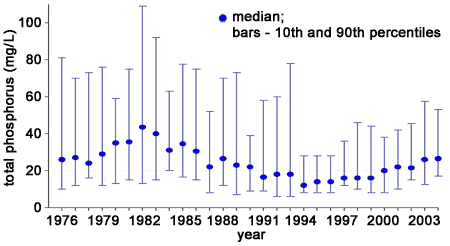
Total phosphorus (TP) concentrations measured at the Union Intake have varied strongly since 1976. For consistency with Nicholls et al. (2001), running medians approximating a year period (48 samples – average number of samples per year) are plotted along with monthly mean concentrations (Figure 2). Values exceeding 208 µg/L have been excluded as outliers. Medians along with 10th and 90th percentiles are plotted in Figure 3.

Figure 2. Monthly mean concentration of total phosphorus (red line) and running median of 48 approximately weekly samples for raw water collected at the Union Water Treatment Plant, 1976-2004.
The wide ranges between the 10th and 90th percentiles (Figure 3) and the similarly wide range in monthly mean concentrations (Figure 2) indicate appreciable variability in concentration among samples and within years. Nicholls et al. (2001) reported that there was statistically significant seasonality in the 1976 to 1999 data with high summer TP levels maintained through the late fall. The high short-term variability in TP concentrations in the western basin is considered to be a result of multiple factors, including seasonal tributary loading and sediment resuspsension from storms (Neilson et al. 1995).

Figure 3. Median annual concentration of total phosphorus (blue circle) and 10th and 90th percentiles (bars) of approximately weekly samples for raw water collected at the Union Water Treatment Plant, 1976-2004.
Overall, Nicholls et al. (2001) noted a significant downward trend in TP concentrations from 1976 to 1999. Within that time period, Nicholls et al. (2001) detected three periods where the annual trend in TP concentrations changed. From 1976 to 1983 TP increased at a rate of 3.4 µg/L/year, from 1983 to 1994 TP declined at a rate of 1.5 µg/L/year, and from 1995 to 1999 TP tended to increase, but was not statistically significant. The overall long-term trend of declining TP has been attributed to the reductions in phosphorus entering Lake Erie. Whole lake TP loads have declined appreciably over the last three decades (Dolan and McGunagle 2005). From 1967 to 1991, point source phosphorus loads into Lake Erie declined by approximately 745 metric tonnes per year (Dolan and McGunagle 2005). In 1967 the phosphorus load exceeded 25,000 metric tonnes/year and declined annually until finally reaching the GLWQA target of 11,000 metric tonnes/year for the first time in 1987. After 1991 to 2001, there was no consistent year-to-year trend in phosphorus loading; however, there was appreciable year-to-year variability, much of which was attributed to nonpoint sources and differing amounts of tributary inputs.
Nicholls (1999) attributed the increase in TP during the late 1970s to the early 1980s to possible sediment regeneration of dissolved phosphorus associated with calm weather and low oxygen levels at the lake bottom. Evidence for this hypothesis was a strong negative relationship between summer wind speed and TP concentration. As noted with the overall decline in TP from 1976 to 1999, the decline in TP during the 1983 to 1994 period was attributed to the annual declines in phosphorus loading. While Nicholls et al. (2001) were not able to detect a significant change in TP concentrations from 1995 to 1999, data from subsequent years (2000-2004) suggest a continued increasing trend in TP concentration since 1994 (Figure 3).
Based on statistical analyses, median total phosphorus appears to be increasing at a rate of approximately 1.4 µg/L/year from 1994 to 2004. The consistent pattern of increasing TP concentration from 1994 to 2004 does not appear to be aligned with trends in phosphorus loading from point sources or nonpoint sources. Estimated annual loads to the western basin from 1994 to 2001 have ranged from 4,140 to 9,588 metric tonnes/year (Dolan and McGunagle 2005) with little evidence of a consistent trend among years; loads were less than 4500 metric tonnes/year in 1994, 1995, 1999 and 2001. The update to the Lake Erie Lakewide Management Plan (2006) notes the possibility that the period of turbidity in the spring is persisting longer than previously and the intensity and timing of storms may be having a greater effect on among-year variability in TP in the last few years.
The underlying cause of the increasing trend in TP concentration since 1994 is unknown. However, two major ecological disruptions have occurred in Lake Erie that are coincident with, and may be contributing to, the trends in TP in recent years. First, while zebra mussels became established in western Lake Erie during 1989-90, stable populations were not reached until the mid-1990s. During their initial invasion period, dreissenids (zebra and quagga mussels) achieved exceptionally high densities, and may have exerted a larger influence on suspended particulate matter than during the period where their population numbers declined and stabilized. It is possible that at least part of the increase in TP from 1994 to 2004 resulted from this stabilization of the dreissenid population.
The second major ecological disruption during this period was the successful invasion of the round goby into western Lake Erie. The timing of the invasion and expansion of the round goby in Lake Erie is curiously coincident with the increasing trend in TP after 2004. The goby was first detected in 1993 and underwent an exponential increase in abundance over the following five years (Bunnell et al. 2005). Johnson et al. (2005) estimated that there were 9.9 billion round gobies in the western basin in 2002. Despite other studies documenting the effect of nonnative fish on phosphorus cycling, there is evidence that round goby density may still not be high enough. Bunnell et al. (2005) modeled the potential effect of the goby invasion on phosphorus cycling in the central basin of Lake Erie using bioenergetics models and field data. He concluded that even at peak densities observed up to 2003, the development of the goby population would have little effect on phosphorus supply. Therefore, direct evidence linking the round goby invasion with phosphorus cycling is lacking.
Management Next Steps
The 2000-2004 increases in total phosphorus (TP) concentrations are unexpected and without an easily identifiable cause. The Union Intake is located in shallow water in relatively close proximity to land. Evaluating the degree to which the intake data represents TP levels and trend over larger areas of the western basin is a necessary step before the significance of the increasing trend can be placed in context. Determining the factors contributing to the apparent rise in water column concentrations, whether they be operating on a local or wider scale, may provide insight on the biological availability of the phosphorus and the potential for adverse ecological effects such as nuisance algae.
The complexity of human-induced, ecological and physical conditions in the western basin makes it difficult to determine the factors causing the recent changes in water column phosphorus levels. A multi-faceted approach which draws upon research and monitoring initiatives will likely be needed.
There have been periodic blooms of cyanobacteria during late summer in the western basin between 1995 and 2007 (Brittain et al. 2000; Vincent et al. 2004; Rinta-Kanto et al. 2005). While ecological factors (namely selective grazing by dreissenid mussels) have been implicated in the recent onset of algae blooms (Vanderploeg et al. 2001), excessive growth of algae is dependent on nutrient availability. The degree to which changing TP levels may be contributing to the competitive advantage of bloom-forming species or to the achievement of bloom levels appears to be uncertain.
In 1995, median TP concentrations in water collected at the Union Water Treatment Plant intake were near the lowest levels observed over the 1976 to 2004 period despite large algal blooms. This suggests that either the intake data may not be representative of the western basin, in particular the southern side of the basin where the blooms have appeared to be more prevalent, or alternatively, that the interplay between ecological process and nutrient availability is as important as nutrient concentration in determining susceptibility to cyanobacteria blooms. Further examination of the role that present levels of nutrients play in the promotion of cyanobacteria blooms is warranted.
Research/Monitoring Needs
Spatial variability in water quality in the western basin is pronounced. As noted above, the degree to which the intake data reflect broader conditions in the basin is unknown and should be evaluated before broad, basin-wide conclusions are made. Further, an improved understanding of the spatial diversity in water quality in the western basin would allow for a more exact analysis of changes through time. An improved understanding of the spatial diversity of water quality would also provide a basis to better account for local or regional factors.
References
- Brittain, S.M., J. Wang, L. Babcock-Jackson, W.W. Carmichael, K.L. Rinehart, and D.A. Culver. 2000. Isolation and characterization of microcystins, cyclic heptapeptide hepatotoxins from a Lake Erie strain of Microcystis aeruginosa. Journal of Great Lakes Research 26:241-249.
- Bunnell, D.B., T.B. Johnson, and C.T. Knight. 2005. The impact of introduced round gobies (Neogobius melanostomus) on phosphorus cycling in central Lake Erie. Canadian Journal of Fisheries and Aquatic Science 62:15-19.
- Dolan, D.M., and K.P. McGunagle. 2005. Lake Erie total phosphorus loading analysis and update: 1996 to 2002. Journal of Great Lakes Research 31(Supplement 2):11-22.
- Johnson, T.B., M. Allen, L.D. Corkum, and V.A. Lee. 2005. Comparison of methods needed to estimate population size of round gobies (Neogobius melanostomus) in western Lake Erie. Journal of Great Lakes Research 31:78-86.
- Lake Erie LaMP. 2006. Lake Erie Lakewide Management Plan (April 2006 update) (September 2006).
- Nicholls, K.H. 1999. Evidence for a trophic cascade effect on north-shore western Lake Erie phytoplankton prior to zebra mussel invasion. Journal of Great Lakes Research 25:942-949.
- Nicholls, K.H., and G.J. Hopkins. 1993. Recent changes in Lake Erie (north shore) phytoplankton: Cumulative impacts of phosphorus loading reductions and zebra mussel introduction. Journal of Great Lakes Research 19:637-647.
- Nicholls, K.H., G.J. Hopkins, S.J. Standke, and L. Nakamoto. 2001. Trends in total phosphorus in Canadian near-shore waters of the Laurentian Great Lakes: 1976-1999. Journal of Great Lakes Research 27:402-422.
- Neilson, M., S. L'Italien, V. Glumac, D. Williams, and P. Bertram. 1995. 1994 State of the Lakes Ecosystem Conference Background Paper. Nutrients: Trends and system response. EPA 905-R-95-015.
- Nicholls, K.H., D.W. Standen, and G.J. Hopkins. 1980. Recent changes in the near-shore phytoplankton of Lake Erie's western basin at Kingsville, Ontario. Journal of Great Lakes Research 6:146-153.
- Rinta-Kanto, J.M., A.J.A. Ouellette, M.R. Twiss, G.L. Boyer, T. Bridgeman, and S.W. Wilhelm. 2005. Quantification of toxic Microcystis spp. during the 2003 and 2004 blooms in western Lake Erie using quantitative real-time PCR. Environmental Science and Technology 39:4198-4205.
- Vanderploeg, H.A., J.R. Liebig, W.W. Carmichael, M.A. Agy, T.H. Johengen, G.L. Fahnenstiel, and T.F. Nalepa. 2001. Zebra mussel (Dreissena ploymorpha) selective filtration promoted toxic Microcystis blooms in Saginaw Bay (Lake Huron) and Lake Erie. Canadian Journal of Fisheries and Aquatic Science 58:1208-1221.
- Vincent, R.K., X. Qin, R.M.L. McKay, J. Miner, K. Czajkowski, J. Savino, and T. Bridgeman. 2004. Phycocyanin detection from LANDSAT TM data for mapping cyanobacterial blooms in Lake Erie. Remote Sensing of Environment 89:381-392.
Contact Information regarding Analysis of Phosphorus Concentrations in the Western Basin of Lake Erie
Todd Howell
Environmental Monitoring and Reporting BranchOntario Ministry of the Environment
E-mail: todd.howell@ontario.ca
Lynda Nakamoto
Environmental Monitoring and Reporting BranchOntario Ministry of the Environment
E-mail: lynda.nakamoto@ontario.ca