Detroit River-Western Lake Erie Basin Indicator Project
Oligochaete Densities and Distribution
Background
Members of the class Oligochaeta include common earthworms. But the aquatic sludge worms (family Tubificidae) are best known for their value as environmental indicators. The name Oligochaeta means "few bristles," which refers to the small bundles of hair-like bristles that occur on each body segment (Figure 1). Tubificid worms have long been recognized as pollution-tolerant because of their ability to thrive under poor water quality conditions. Their blood contains hemoglobin, which enables them to survive in waters where oxygen is lacking. Hemoglobin (the same oxygen transporting protein in our blood) absorbs and retains oxygen from the water. Because oligochaetes are small and relatively immobile, they lack the ability to escape environmental stress (e.g., contaminated sediments), making them a useful indicator of local benthic conditions (Farara and Burt 1993). Howmiller and Scott (1977) showed that low oligochaete diversity occurs in unpolluted, undisturbed environments. However, low densities of worms do not always indicate clean water conditions. Sediments severely polluted with toxic materials may be degraded to the point where even oligochaete survival is unlikely and densities may be low for this reason (Ciborowski 2003). Typically, benthic environments rich in organic materials (such as algae and bacteria stimulated by sewage or nutrient runoff) support a disproportionately large abundance of oligochaetes (Hynes 1971).
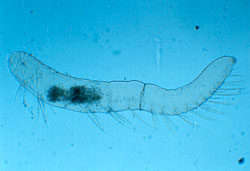
Figure 1. Oligochaete with setae visible. Oligochaetes typically have four pairs of setae (chaetae) per segment which are used during burrowing and crawling movements (Photo credit: USGS, Great Lakes Science Center).
A healthy aquatic ecosystem supports a balanced benthic community that is made up of a mix of benthic species and is not dominated by oligochaetes. When an area becomes disturbed, species diversity declines and pollution-tolerant organisms such as oligochaetes and chironomid midge larvae replace pollutant-sensitive species (Farara and Burt 1993). Wright (1955) suggested that the degree of pollution in Great Lakes locations could be summarized by aquatic oligochaete abundance. Worm densities of 100-999 per square meter were said to indicate light pollution, moderately polluted areas supported 1,000-5,000 worms per square meter, and densities of worms exceeding 5,000 per square meter were representative of heavily- polluted areas. When oligochaete worms are used as pollution descriptors, they are often evaluated in reference to the bottom sediment from which they are found. Lafont (1984) compared oligochaete communities from fine sediments of polluted rivers to toxicity measurements in the water. He found that the fewest oligochaete species and the highest relative abundance of Tubificidae occurred in the most polluted areas.
Milbrink (1983) developed an environmental index based on oligochaete abundance and species diversity, arguing that it is more useful to examine oligochaete community composition than to use a single indicator species on its own. Milbrink's environmental index is based on the Saprobien System, which classifies organisms according to their tolerance to organic pollution in streams. The index characterizes the ecological requirements of each oligochaete species with respect to its tolerance of organic pollution or eutrophic conditions.
Status and Trends
The oligochaetes of western Lake Erie and the lower Detroit River have been studied since as early as 1929 when Wright and Tidd (1933) conducted a density survey of various zoobenthic fauna. At that time, areas with densities > 5,000 worms per square meter were found near the mouths of the Maumee River and River Raisin (Ciborowski 2003).
Between the 1960s and early 1990s, oligochaete worms indicated that parts of the Detroit River were severely enriched from sewage effluent. Downstream of Belle Isle, densities were approximately 500,000 per square meter , and downstream of the confluence between the Detroit and Rouge rivers, densities were as high as one million per m2 (Thornley and Hamdy 1984). Both of these areas were likely affected primarily by effluents from sewage treatment plants.
Canadian shoreline water quality conditions were apparently less degraded at this time, as indicated by a more balanced benthic community structure (Thornley and Hamdy 1984). Along the U.S. shoreline, worms accounted for 78% of the total number of organisms collected in both 1968 and 1980 (Thornley and Hamdy 1984). In 1980, downstream of the mouth of the Rouge River, aquatic worms constituted 80-99% of the total number of invertebrates. Tubifex tubifex was the dominant species, reaching numbers as high as 1.5 and 1.9 million per square meter at these locations. Thornley and Hamdy (1984) stated that "the 1980 data were essentially unchanged from 1968 and represented a continuing major disruption of the benthos."
Zoobenthic community composition also suggested that the lower Detroit River was very degraded prior to the mid-1960s. In 1961, 99% of the oligochaete species collected in the Detroit River were Tubificidae (Carr and Hiltunen 1965). Overall, oligochaetes were the most numerous zoobenthos collected (greatest abundance at all but three sites) and at only ten stations did they contribute less than 50% of the total organisms (Carr and Hiltunen 1965). Carr and Hiltunen (1965) used these worm densities to estimate the area (square kilometers) of zones of pollution. They classified 12% of the Detroit River as lightly polluted, 53% as moderately polluted and 35% as heavily polluted (compared to 1930 data in which no part of the Detroit River was heavily polluted).
Estimates of oligochaete abundance are available from five Detroit River surveys conducted between 1968 and 2004 (Figure 2). Because the data were collected and compiled from various sources* there is variation in the number and location of sites sampled, and the times of year during which they were sampled. Riverwide estimates of average densities have ranged from about 1,200 worms per square meter (in 1999) to almost 7,000 per square meter (in 1991). Densities in 2004 were substantially higher than they were in 1999, suggesting that water quality was poorer in 2004. However, surveys have been conducted too irregularly to indicate whether the differences seen among years represent progressive changes in the river's condition or merely year-to-year variation. *[Data compiled from Thornley and Hamdy (1984), Farara and Burt (1993), Wood (2004), and Ciborowski et al. (2006)].
Figure 2. Mean ±SE density of oligochaetes in the Detroit River between 1968 and 2004. The numeral beside each bar indicates the number of sites sampled during that year. *Data compiled from Thornley and Hamdy (1984), Farara and Burt (1993), Wood (2004), and Ciborowski et al. (2006). Ranges of eutrophication are based on Wright (1955).
Oligochaete abundances are especially useful at showing the location of point source pollution "hot spots" (Figure 3, 1999 and Figure 4, 2004 ). Sites located along the Trenton Channel and one site (Ecorse site) located just downstream of Ecorse, Michigan (where U. S. Steel is located) have historically been recognized as among the most polluted areas of the Detroit River due to urban and industrial development along the shorelines. Mean oligochaete densities at these sites greatly exceeded the designated heavy pollution value of 5,000 per square meter in all years except 1999. Prior to 1980, these locations had between 100,000 and 1 million worms per square meter (Figure 5). Although conditions have dramatically improved and worm densities have been reduced by 80-90% since 1980, the numbers present suggest that these locations still fall in the "heavily polluted" category.
Figure 3. Percentage of Oligochaetes in the Detroit River in 1999 interpolated from data compiled from Wood (2004). Map by Anita Kirkpatrick. Click here for a larger map.
Figure 4. Percentage of Oligochaetes in the Detroit River in 2004 interpolated from data compiled from Ciborowski et al. (2006). Map by Anita Kirkpatrick. Click here for a larger map.
Some oligochaete data also exist for western Lake Erie. In 1982, oligochaete and sediment samples were collected at 40 stations along the coast of western Lake Erie and compared to samples collected at the same sites in 1961 (Schloesser et al. 1995). Total worm densities, as well as species diversity, were used to infer pollution levels. The comparison indicated improved water quality in the nearshore areas, but increased eutrophic substrate conditions in the western basin of Lake Erie near the mouth of the Detroit River (Schloesser et al. 1995).
Figure 5. Geometric mean ±SE density of oligochaetes in the Trenton Channel and at one Ecorse site between 1968 and 2004 (note logarithmic scale). The numeral beside each bar indicates the number of sites sampled during that year. *Data compiled from Thornley and Hamdy (1984), Farara and Burt (1993), Wood (2004), and Ciborowski et al. (2006).
Management Next Steps
The available data clearly indicate portions of the river that have historically been most heavily degraded by organic enrichment and those that are still affected by nutrient-rich water, primarily sewage and storm water. The oligochaete data show the extent to which river water quality in the Trenton Channel has improved between 1980 and the early 1990s. However, continued attention to point sources of pollution will be necessary to bring the oligochaete classification into the "moderately polluted" category.
Research/Monitoring Needs
Oligochaete monitoring needs to be conducted yearly if precise time trends are to be determined. Sampling methods (collection times, site locations, number of sites sampled) should be standardized among years to improve the precision of riverwide density estimates.
An oligochaete species index looking at species composition has the potential to be an effective indicator of water quality issues. However, implementation relies on intensive and frequent sampling in addition to the ability to identify Oligochaeta worms to genus and/or species level.
References
- Carr, J., and J. Hiltunen. 1965. Changes in the bottom fauna of western Lake Erie from 1930 to 1961. Limnology and Oceanography 10(4):551-569.
- Ciborowski, J.J.H. 2003. Lessons from sentinel invertebrates: Mayflies and other species. In Honoring Our Detroit River: Caring For Our Home,ed.John H. Hartig, pp. 107-120. Bloomfield Hills, MI: Cranbrook Institute of Science.
- Ciborowski, J.J.H., J. Zhang, J. Baillargeon, and A. Kirkpatrick. 2006. Section 6 – Zoobenthos.Benthos and sediment chemistry studies on the Detroit and St. Clair rivers. InGreat Lakes Institute for Environmental Research et al. Draft report prepared for Great Lakes Sustainability Fund.
- Farara, D.G., and A.G. Burt. 1993. Environmental assessment of Detroit River sediments and benthic macroinvertebrate communities–1991. Report prepared for the Ontario Ministry of Environment and Energy by Beak Consultants Limited, Brampton, Ontario. Volume I.
- Howmiller, R.P., and M.A. Scott. 1977. An environmental index based on the relative abundance of oligochaete species. Journal of the Water Pollution Control Federation 49:809-815.
- Hynes, H.B.N. 1971. The Biology of Polluted Waters. Toronto, Ontario: University of Toronto Press.
- Lafont, M. 1984. Oligochaete communities as biological descriptors of pollution in the fine sediments of rivers. Hydrobiologia 115:127-129.
- Milbrink, G. 1983. An improved environmental index based on the relative abundance of oligochaete species. Hydrobiologia 102:87-89.
- Schloesser, D.W., T.B. Reynoldson, and B.A. Manny. 1995. Oligochaete fauna of western Lake Erie 1961 and 1982: Signs of sediment quality recovery. Journal of Great Lakes Research 21(3):294-306.
- Thornley, S., and Y.H. Hamdy. 1984. An assessment of the bottom fauna and sediments of the Detroit River. Ontario Ministry of the Environment, Southwestern Region and Water Resources Branch, Toronto, Ontario.
- Wood, S. 2004. The use of benthic macroinvertebrate community composition as a measure of contaminant induced stress in the sediments of the Detroit River. M.Sc. Thesis, University of Windsor, Ontario.
- Wright, S., and W.M. Tidd. 1933. Summary of limnological investigations in western Lake Erie in 1929 and 1930. Transactions of the American Fisheries Society 63:271-285.
- Wright, S. 1955. Limnological survey of western Lake Erie. U.S. Fish and Wildlife Service, Special Scientific Report: Fisheries No.139.
Contact Information regarding Oligochaete Densities and Distribution
Dr. Jan Ciborowski
Department of Biological SciencesUniversity of Windsor
E-mail: cibor@uwindsor.ca