Detroit River-Western Lake Erie Basin Indicator Project
Phosphorus Loads and Concentrations from the Maumee River
Background
Lake Erie has a long history of cultural eutrophication. During the 1960s, algal blooms induced by excess nutrients led to oxygen depletion of deeper waters and caused fish kills. Phosphorus was judged to be the most readily controllable nutrient required for algal growth. Consequently, the U.S. and Canadian governments worked through the Great Lakes Water Quality Agreement to set an annual phosphorus target load of 11,000 metric tons to control water quality problems associated with phosphorus enrichment. This phosphorus control program called for controlling phosphorus from municipal wastewater treatment plants, agricultural and urban runoff, and cleaning agents and laundry detergents. The target load was met for the first time in 1981. Since then, the target has been met in most years. Nonpoint source loads, especially those from agriculture, vary greatly from year to year due to differences in weather (Figure 1).
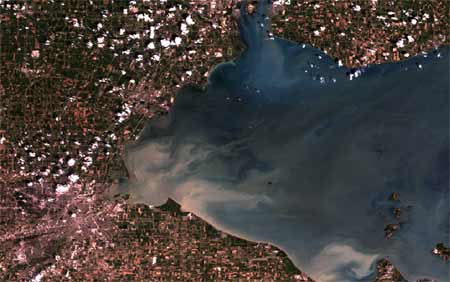
Figure 1. Sediment loading from the Maumee River originating from agricultural nonpoint source inputs (Photo credit: NASA Landsat Program).
The Maumee River is the largest tributary to Lake Erie. Its watershed of more than 16,835 square kilometers (6,500 square miles) is located mostly in northwest Ohio, with smaller portions in eastern Indiana and southern Michigan. Water from the Maumee River enters Lake Erie's western basin at Toledo. The Maumee River is also the single largest source of phosphorus loading to Lake Erie, with the majority of the load coming from agriculture. More than 80% of the watershed is devoted to agricultural land uses. For more information about the Maumee River watershed, see Richards et al. (2002a).
The National Center for Water Quality Research (NCWQR) at Heidelberg College in Tiffin, Ohio has been monitoring water quality in the Maumee River since 1975. The sampling station is located at the Bowling Green drinking water intake, near the USGS gaging station at Waterville, Ohio. Three samples per day are collected by an automatic sampler. The samples are collected weekly and returned to the Center's Water Quality Laboratory for analysis. During periods of low flow, one sample per day is analyzed; at other times, all three samples are analyzed. This program produces about 425 samples per year and provides the most detailed data for nutrient load determination available anywhere in the Great Lakes (www.heidelberg.edu/wql). Previous studies of water quality trends in the Maumee River are included in Richards (2006), Richards et al. (2002b), and Richards and Baker (2002).
Status and Trends
Annual loads of total phosphorus (TP) from the Maumee River are shown in Figure 2. There is a gap in the graph because of a lack of funding during 1979-1981. While weather-related annual variation in these loads is great and renders suspect any apparent short-term trends, there does appear to be a downward trend over the entire period of record, as indicated by the trendline. This trend does not achieve statistical significance (p=0.065), but it suggests a decrease in the annual loads of about 33% over the 30-year period of record. On average during this time, the Maumee River annual load to Lake Erie is about 19% of the estimated total annual load from all sources.
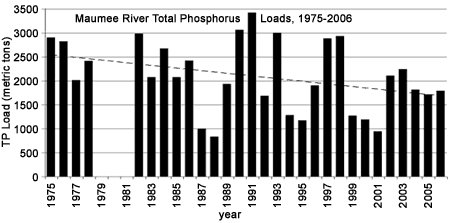
Figure 2. Total phosphorus loads in the Maumee River at Waterville, 1975-2006. The downward trend of about 33% is not statistically significant.
Dissolved reactive phosphorus (DRP) is that portion of total phosphorus that is readily available for algal and other plant growth. Typically about 10-30% of TP in the Maumee is DRP. DRP in the Maumee River has decreased approximately 10% over the period of record, but this trend is not statistically significant (Figure 3).
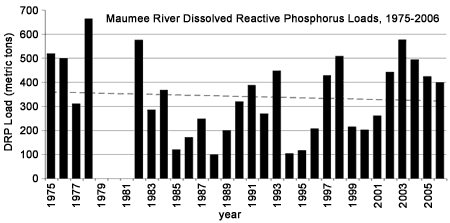
Figure 3. Dissolved reactive phosphorus loads in the Maumee River at Waterville, 1975-2006. The downward trend of about 10% is not statistically significant.
Although annual TP loads are the measure by which we evaluate success in managing inputs to Lake Erie, important information can also be obtained by examining trends in flow-weighted mean concentrations (FWMCs) of total phosphorus and of other forms of phosphorus. The FWMC is the load divided by the discharge. FWMC plots are prepared to make long-term trends more apparent.
The plot of TP FWMCs shows a 42% decrease over the period of record (Figure 4), similar to the plot of TP loads. However, this trend is statistically significant. The plot of DRP FWMCs (Figure 5) shows a 57% decrease between the early 1970s and early 1990s, and then an approximate 90% increase between the early 1990s and 2006.
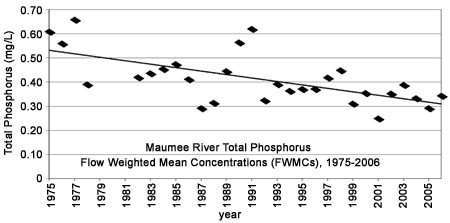
Figure 4. Total phosphorus annual flow-weighted mean concentrations for the Maumee River at Waterville, 1975-2006. The downward trend is highly significant and is a 42% decrease.
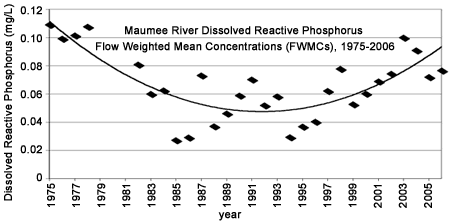
Figure 5. Dissolved reactive phosphorus annual flow-weighted mean concentrations for the Maumee River at Waterville, 1975-2006. The parabolic trend is highly significant and represents a decrease of 57% followed by an increase from the minimum of 94%.
Figure 6 shows DRP as a percent of TP. The percentage of DRP in TP decreased from about 21% in the early 1970s to about 12% in 1989, then increased to 27% in recent years.
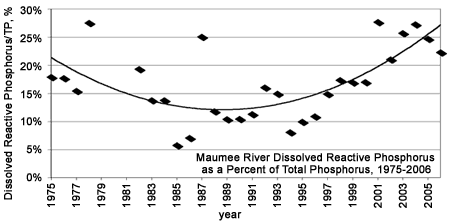
Figure 6. Dissolved reactive phosphorus as a percent of total phosphorus, annual values for the Maumee River at Waterville, 1975-2006. The parabolic trend is highly significant and represents a decrease of 57% followed by an increase from the minimum of 125%.
Finally, Figure 7 provides a plot of the difference between TP and DRP (TP-DRP). This estimates the portion of the TP that is attached to or contained in sediment particles, called particulate phosphorus (PP). PP is bound phosphorus that is only partly available to plant growth. Like TP, PP shows a statistically significant decrease of 45% over the period of record.
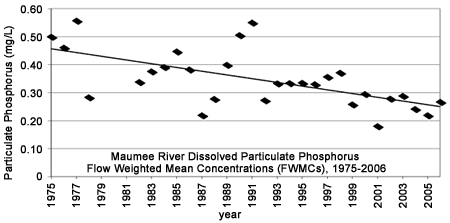
Figure 7. Particulate phosphorus annual flow-weighted mean concentrations for the Maumee River at Waterville, 1975-2006. The downward trend is highly significant and is a 45% decrease.
Decreases in phosphorus loads and concentrations are generally considered desirable, although some Lake Erie fisheries managers have expressed concern that overly large reductions might lead to reduced fish production. The downward trends seen in these data document the success of management efforts over the last three decades to control export of phosphorus into Lake Erie. The sharp increases in DRP in the last decade or so are troublesome, and reasons for these increases are unclear. Similar increases are seen in several other Lake Erie tributaries. Lake Erie has been showing signs of nutrient stress in the last decade, including increasing in-lake phosphorus concentrations in the spring, increased hypoxia in the central basin in the summer, and increased abundance of nuisance algae such as Cladophora and noxious cyanobacteria such as Microcystis. While some researchers have pointed to zebra mussels and their impact on lake ecosystems as the cause of these problems, increased DRP loadings from the tributaries must also be considered.
Management Next Steps
Efforts are needed to reverse the trend toward increasing dissolved reactive phosphorus. The cause or causes of the increasing trend are not clear at this time, but a number of management actions could be taken that will contribute to reductions in DRP. These include:
- improved fertilizer/manure management to minimize enrichment of phosphorus in the surface layer of the soil, and especially no-till agriculture, which reduces soil erosion by keeping crop and plant residues on the surface longer;
- improvements in the regulation and management of liquid manures from concentrated animal operations;
- use of cover crops in the winter to tie up nutrients and protect the soil;
- reductions in fall fertilization and spreading of manure in fall and winter, especially in the absence of cover crops;
- incorporation of fertilizer/manure into the soil rather than surface application;
- continued reductions in sewage treatment plant effluent concentrations to counter human population growth in the basin;
- reduction or elimination of combined sewer overflows and sewage bypasses;
- improvements in the functioning of home septic systems and small-scale treatment systems;
- elimination of direct connections of rural home septic systems into agricultural drain tiles and ditches;
- improved management of urban nonpoint runoff; and
- reduction or elimination of phosphorus from lawn fertilizers.
Research/Monitoring Needs
Major budgetary cuts have occurred in monitoring and research for the Lake Erie tributaries. The collection and interpretation of water quality data, on which we base our current knowledge of phosphorus in the Maumee River and Lake Erie, is a program of the National Center for Water Quality Research. While this program continues without reductions, it is in constant jeopardy of being cut or eliminated. Without it, estimates of total annual phosphorus loads for Lake Erie, the basic yardstick by which we assess success in managing Lake Erie, will not be possible (Dave Dolan, Natural and Applied Sciences at University of Wisconsin-Green Bay, personal communication 2004). This critical program needs to be continued, and should be funded on a permanent basis.
Research is needed to determine the cause or causes of increased dissolved reactive phosphorus in the Lake Erie tributaries, and to determine the importance of these increases as a possible cause of renewed problems in Lake Erie itself.
Research is also needed to better understand the linkages between the tributaries and the lake. How are tributary phosphorus loads modified by their passage through embayments and the nearshore zone? Are loadings in certain seasons more important to Lake Erie than those in other seasons?
And finally, research is needed to better understand the relationships between total phosphorus and dissolved reactive phosphorus, and the reasons that this relationship has changed over time (at least in the tributaries). How much of the total phosphorus that enters the lake from the tributaries is taken up by algae and other primary producers, and over what time scale? Would we understand the lake better if we built our concepts and models around dissolved reactive phosphorus rather than total phosphorus?
References
- Richards, R.P. 2006. Section 10.10. Trends in sediment and nutrients in major Lake Erie tributaries, 1975-2004. In Lake Erie Lakewide Management Plan 2006 Update.
- Richards, R.P., F.G. Calhoun, and G. Matisoff. 2002a. The Lake Erie Agricultural Systems for Environmental Quality project: An introduction. Journal of Environmental Quality 31:6-16.
- Richards, R.P., D.B. Baker, and D.J. Eckert. 2002b. Trends in agriculture in the LEASEQ watersheds, 1975-1995. Journal of Environmental Quality 31:17-24.
- Richards, R.P., and D.B. Baker. 2002. Trends in water quality in LEASEQ rivers and streams, 1975-1995. Journal of Environmental Quality 31:90-96.
Contact Information regarding Phosphorus Loads and Concentrations from the Maumee River
R. Peter Richards
Senior Research ScientistHeidelberg College
National Center for Water Quality Research
E-mail Address: prichard@heidelberg.edu