Detroit River-Western Lake Erie Basin Indicator Project
Contaminants in Western Lake Erie Fish Community
Background
Since 1977, the Canadian Department of Fisheries and Oceans has been conducting an annual monitoring program to assess the temporal trends of contaminant burdens in representative top predator and forage fish species from Lake Erie (Figure 1). The Lake Erie survey is part of a binational Great Lakes Fish Contaminants Surveillance Program which is initiated in response to the specific requirements of Annex 11 (Surveillance & Monitoring) of the Great Lakes Water Quality Agreement. The intent of this program was: "To survey collectively, the concentration of contaminants in selected species of Great Lakes fish and other biota with the specific purpose of determining environmental trends in contaminant levels and relating these, where possible, to sources of such pollution, the effectiveness of remedial actions, and the potential implications to Great Lakes fish stocks" (Whittle et al. 2003).

Figure 1. Figure 1. Rainbow Smelt - Osmerus mordax averages 7-8 inches. (Photo Credit: New York State Department of Environmental Conservation)
Remedial activities, related to contaminant control, routinely address sources. The reduction of point source discharges is often followed by a decrease in the amount of contaminant in the ambient environment and therefore, available for accumulation by the biological community. The use of fish as indicators of the level of bioavailable contaminants has long been seen as a valuable tool for environmental monitoring and a measure of the success of remedial actions related to the elimination or reduction of contaminant sources. Assessment of temporal trend contaminant burden data for fish has often focused on the fact that changes in concentrations are uniquely related to changes in point source discharges.
Pressures
The issue of the impact of changes in the abundance and variety of invasive nuisance species on toxic chemical cycling in Great Lakes is still an expanding topic. The number of both exotic invertebrates and fish species proliferating in Great Lakes ecosystems continues to increase both temporally and spatially. Changes imposed on the form and function of native fish communities by exotics will subsequently alter ecosystem energy flows. As a consequence the pathways and fate of persistent toxic substances will be altered resulting in different accumulation patterns, particularly at the top of the food web. This phenomenon was witnessed in the late 1980s in the Lake Erie system after the invasion and proliferation of zebra mussels. Some contaminant levels peaked for short periods in fish and subsequently decreased. Each of the Great Lakes is currently experiencing changes in the structure of the aquatic community and hence there may be periods of increases in contaminant burdens of some fish species. Added stressors in the future will be the issue of climate change with the potential for warming effects to change the availability of Great Lakes critical habitats change the productivity of some systems, accelerate the movement of contaminants from abiotic sources into the biological community and further effect the composition of biological communities. All of the above will affect temporal trends in contaminant burdens measured in various fish species throughout the Great Lakes basin (Morrison et al. 2000).
Status and Trends
Since the late 1970s, concentrations of historically regulated contaminants such as polychlorinated biphenyls (PCBs), dichloro-diphenyl-trichloro-ethane (DDT) and mercury have generally declined in most monitored fish species. The changes are often lake specific and relate both to the specific characteristics of the substances involved and the biological conditions of the fish community (Whittle et al. 2004).
Rainbow smelt represents a major prey species in the Lake Erie fish community. For this indicator report, the rainbow smelt data are from fish collected throughout Lake Erie (i.e., Western, Central, and Eastern Basins) and are known to be representative of conditions in the Western Basin. Levels of mercury measured in 2002 Lake Erie smelt samples were the highest concentrations reported since the whole lake survey was initiated in 1977 (Figure 2). The 2003 levels then declined by 66%, the mean value was the 2nd lowest concentration reported since 1977. The levels then increased again in 2004.
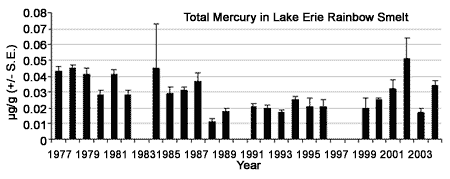
Figure 2. Total mercury levels in Lake Erie Rainbow Smelt (µg/g +/- S.E. wet weight, whole fish), 1977-2004 (2004 data unpublished).
Total PCB levels in rainbow smelt have also been measured since 1977 (Whittle 1998). PCB levels demonstrated a rapid and continuous significant increase from the period 1985-1986 through 1990 when they reached a maximum level of 0.76 µg/g, most likely due to the invasion of zebra and quagga mussels (Figure 3). After 1990, total PCB levels in smelt declined and remained at levels averaging about 0.10 µg/g through 2001. PCBs then exhibited a significant concentration increase in 2002. Levels were anomalously high (0.39 µg/g) for that single year and then declined by 80% in 2003.
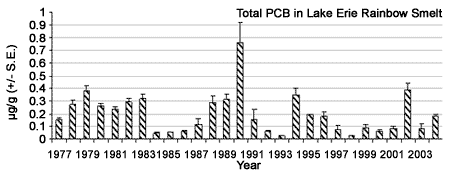
Figure 3. Total PCB levels in Lake Erie Rainbow Smelt (µg/g +/- S.E. wet weight, whole fish), 1977-2004 (2004 data unpublished).
Overall, concentrations of total DDT in Rainbow smelt were about 60% lower in recent years compared to the late 1970s, but exhibited a fair degree of year-to-year variability (Figure 4). The pattern of a dramatic increase from 1985-1986 through 1989 was also evident with respect to total DDT levels in Lake Erie rainbow smelt. Between 1989 and recent years, DDT concentrations generally declined, but still showed year-to-year variability. For example, the 2003 mean value was almost an order of magnitude lower (0.01 vs. 0.09 µg/g) than the 1989 value measured during the height of the zebra and quagga mussel proliferation in Lake Erie.
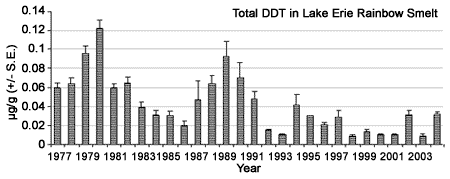
Figure 4. Total DDT levels in Lake Erie Rainbow Smelt (µg/g +/- S.E. wet weight, whole fish), 1977-2004 (2004 data unpublished).
For this indicator report data for 4 +-6 + year old walleye collected exclusively from the Western Basin of Lake Erie were assessed. Walleye were collected in the fall, but fish are known to migrate between the Western and Central Basins at points throughout the year.
After a period of rapid decline (approximately 60%) from 1977 through 1983, mercury concentrations in Lake Erie walleye have remained fairly steady (Figure 5). After 1996 the frequency of annual measurements of mercury burdens in walleye was reduced. The mean of two recent measurements made in 1999 and 2003 was approximately 15% greater than the five-year mean of the period 1992 through 1996.
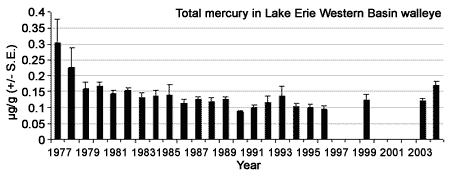
Figure 5. Total mercury levels in 4+-6+ year old walleye from the Western Basin of Lake Erie (µg/g +/- S.E. wet weight, whole fish), 1977-2004 (2004 data unpublished).
In general, total PCB levels in walleye from the Western Basin were lower in the 1980s and 1990s compared to late 1970s (Figure 6). However, over the 28 year period, concentrations fluctuated considerably. There have been periodic increases (1984-86, 1989-92) in PCB body burdens followed by decreases through to the mid-1990s (Whittle 1998).
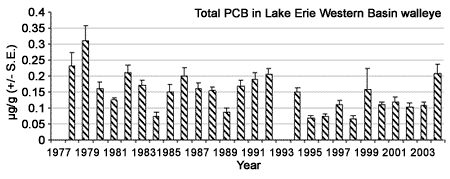
Figure 6. Total PCB levels in 4+-6+ year old walleye from the Western Basin of Lake Erie (µg/g +/- S.E. wet weight, whole fish), 1977-2004 (2004 data unpublished).
Total DDT levels in walleye have declined by an order of magnitude since monitoring commenced in 1977. Levels increased modestly during the period 1987 through 1989, which was coincidental with the zebra and quagga mussel invasion period. Since 1989 annual mean total DDT levels have declined consistently in walleye samples and the 2003 mean concentration (0.06 mg/g) is the lowest ever measured since the initiation of the Canada Department of Fisheries and Oceans monitoring program in 1977 (Figure 7).
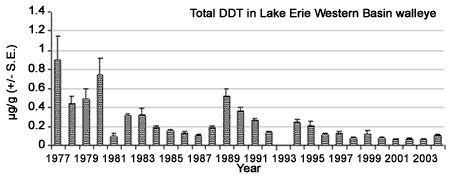
Figure 7. Total DDT levels in 4+-6+ year old walleye from the Western Basin of Lake Erie (µg/g +/- S.E. wet weight, whole fish), 1977-2004 (2004 data unpublished).
Management Next Steps
Control of contaminants at their source remains the primary imperative for management action. Additional sediment remediation will be required at certain locations (e.g., Trenton Channel of the Detroit River, Lower Rouge River, River Raisin, Ottawa River) to restore uses and meet the objectives of the Great Lakes Water Quality Agreement.
Research/Monitoring Needs
Contaminants contained in the sediments of the shallow Western Basin of Lake Erie are often resuspended during storm events and become available in the water column in the freely dissolved form. Based on models developed by Morrison et al. (1997, 2002), the continued reduction in contaminant inputs to the system and a decontamination of the bottom sediments would reduce the availability of contaminants to aquatic biota. A continuation of this modeling activity to incorporate both changes in upstream loadings of contaminants and the ongoing response of the biological community to introductions of additional exotic invading species would be useful in focusing future remedial activities. These modeling activities would support the analyses of temporal trend contaminant data as measured in aquatic biota representing different trophic levels (Whittle et al. 2003).
References
- Morrison, H.A., F.A.P.C. Gobas, Rodica Lazar, D.M. Whittle and G.D. Haffner. 1997. Development and Verification of a Benthic/Pelagic Food Web Bioaccumulation Model for PCB Congeners in Western Lake Erie. Environmental Science Technology. 31: 3267-3273.
- Morrison, H.A., D.M. Whittle and G.D. Haffner. 2000. The Relative Importance of Species Invasions and Sediment Disturbance in Regulating Chemical Dynamics in Western Lake Erie. Ecological Modeling. 125: 279-294.
- Morrison, H.A., D.M. Whittle, and G.D. Haffner. 2002. A comparison of the transport and fate of PCBs in three Great Lakes food webs. Environmental Toxicology and Chemistry. 21:683-692.
- Whittle, D.M. 1998. The Great lakes Ecosystem in Chemical Contaminants in Canadian Aquatic Ecosystems. R.C. Pierce, D.M. Whittle & J.B. Bramwell Eds. PWGSC Publishers (ISBN 0-660-17475-8). pp. 105-135.
- Whittle, D.M., M.J. Keir and A.A., Carswell. 2003. Western Lake Erie Fish Community Contaminant Trends (1977-2001). In: Evaluating Ecosystem Results of PCB Control Measures within the Detroit River-Western Lake Erie Basin (T.M. Heidtke, J. Hartig and B. Yu, Eds.), pp. 89-91. EPA-905-R-001, Chicago, IL.
- Whittle, D.M., M.J. Keir and J.F. Gorrie. 2004. DFO Open Lake Fish Contaminants Monitoring Program. Great Lakes Laboratory for Fisheries & Aquatic Sciences. Burlington, ON. L7R 4A6. Submission to State of the Lakes Ecosystem Conference (SOLEC) 2004 Indicators Report , Indicator ID #121 Contaminants in Whole Fish. pp. 27.
Contact Information regarding Contaminants in Western Lake Erie Fish Community
Sean Backus
Environment CanadaE-mail:sean.backkus@ec.gc.ca