Detroit River-Western Lake Erie Basin Indicator Project
Lake Level Changes in Lake Erie
Authors
Erin Maher, Great Lakes Integrated Sciences + Assessments, University of Michigan, eemaher@umich.eduKimberly Channell, Great Lakes Integrated Sciences + Assessments, University of Michigan, kimchann@umich.edu
Background
While sea levels have risen gradually in response to warming global surface temperatures, the response of water levels in the Great Lakes is more variable and unpredictable. Fluctuations in Great Lakes water levels can be seen on both long- and short-term time scales. Seasonally, the primary drivers of these fluctuations are precipitation, evaporation, and runoff (Deacu et al., 2012). Longer-term variability is more difficult to predict, leading to uncertainty about how Lake Erie water levels will fluctuate in the future.
The Great Lakes system is complex and interconnected. While Lake Erie is a hydrologically distinct lake, it is connected to both Lakes Huron and Ontario. Water flows from Lake Huron into Lake Erie though the Huron-Erie Corridor, which consists of the St. Clair River, Lake St. Clair, and the Detroit River. Water from Lake Erie then flows over Niagara Falls into Lake Ontario. Water levels on Lake Erie are therefore connected to water levels of the entire Great Lakes System, adding to the complexity of water level predictions.
It is important to consider and monitor changes in water levels in Lake Erie as changes in lake levels have many different impacts. High water levels can cause flooding, property inundation, and coastal erosion, while low water levels can lead to negative impacts on shipping and navigation, seasonal recreation, and coastal wetland habitats for birds and fish (Gronewold et al., 2013).
In the following section, historical water levels in Lake Erie are visualized and discussed using data from the Great Lakes Environmental Research Laboratory (GLERL), which compiles monthly data from the U.S. Army Corps of Engineers (NOAA Great Lakes Environmental Research Laboratory; Hunter and Croley, 1993; Quinn and Kelley, 1983). The use of data sourced from GLERL allows for high confidence in the analyses of this data.
Status and Trends
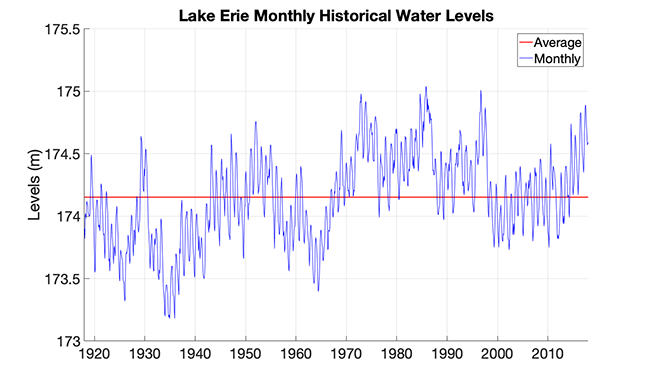
Variability of water levels in Lake Erie are observed on many different time scales, including seasonal, annual, and decadal. Figure 1 below shows monthly average water levels compared with the historical long-term average. Long-term fluctuations in Lake Erie water levels are evident in this figure, with decades of above- and below-average water levels.

Figure 1. Monthly average water levels for Lake Erie (blue) from 1918-2018 shown here with the historical average (red) to demonstrate variability of lake levels.
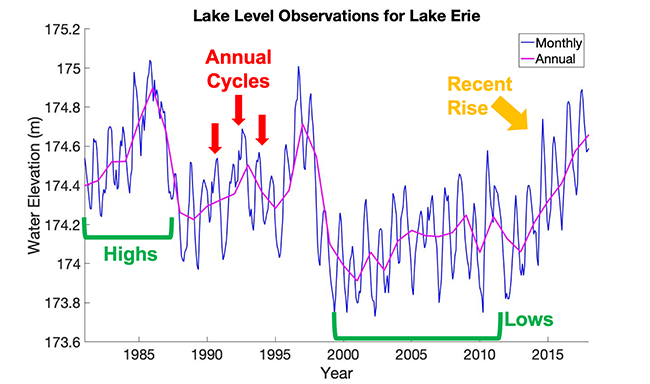
Lake levels experience annual cycles and multi-year periods of high and low levels. To demonstrate this, Figure 2 presents a truncated version of Figure 1, on a shorter timescale, with added annotations and an additional line displaying annual average lake levels. The periods of sustained highs and lows are variable in length, which is indicative of the unpredictability of lake level variability.

Figure 2. Monthly (blue) and annual (pink) average lake levels for Lake Erie with added annotations denoting annual cycles, highs, lows, and the recent rise.
Along with historical highs, lows, and annual cycles, a recent rise in lake levels is also evident in Figure 2. The Great Lakes, including Lake Erie, have recently experienced a period of rising water levels, which follows an approximately ten-year period of low levels. This trend goes against previously predicted decreases in water levels. Such predictions were made with methods that used atmospheric temperatures as a proxy for evaporation rates, which have since been found to have overestimated projections for evaporation and lake level declines (Hayhoe et al., 2010, Lofgren and Rouhana, 2016).
This deviation from previously predicted patterns is consistent with evidence that supports the idea that variability in lake level fluctuations will increase (Gronewold and Rood, 2019). Although Lake Erie is currently experiencing a rise in lake levels, it is uncertain as to how long this will continue.
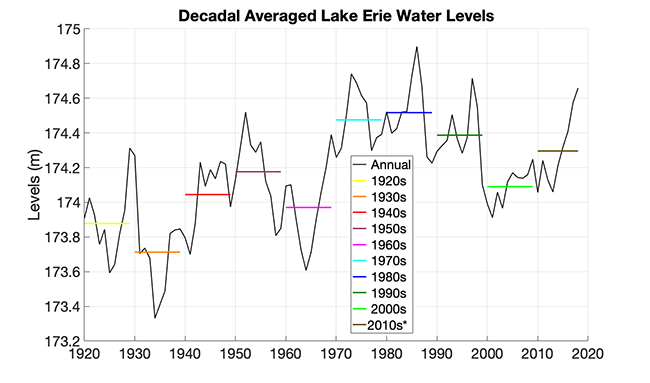
The variability of water levels in Lake Erie can be demonstrated using decadal averages, as seen in Figure 3. Overall, earlier decades, such as the 1930s and 1940s, had lower lake levels than later decades, such as the 1980s and 2010s. The current decade (2010s) of higher water levels occurred after a period of low lake levels, as mentioned above.

Figure 3. Decadal averaged water levels in Lake Erie (colored horizontal lines) plotted with annual time series (black).
*The decadal average for the 2010s is calculated using data from 2010-2018 as the data for 2019 was not yet available at the time of the analysis.
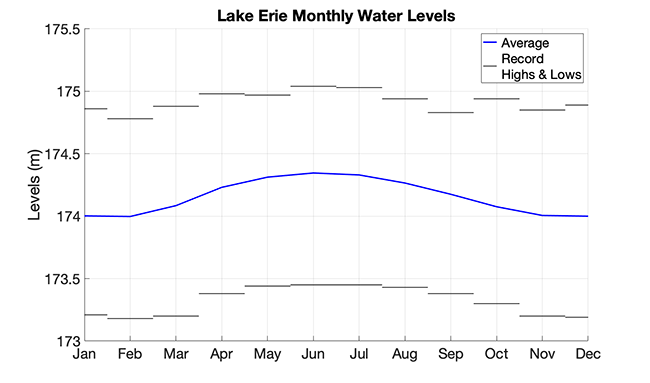
The current rise has not yet caused the levels to surpass the overall-record high level for Lake Erie, set in the late 1980s, however, several monthly average records have been set in 2019 (U.S. Army Corps of Engineers, 2019). Figure 4 shows these record monthly highs plotted with record monthly lows and average monthly water levels for Lake Erie. The record lows were set in the mid-1930s, and there has not been a period that came close to breaking these records since.

Figure 4. Monthly average water levels in Lake Erie (blue solid) plotted with monthly record highs and lows (black horizontal lines).
This figure also displays the annual cycle of water levels. Water levels on all Great Lakes rise in the spring and summer due primarily to snowmelt runoff and low evaporation rates, and decline in the fall due to high evaporation rates from the temperature difference between the air (cold) and water (still warm from summer months). On average, the highest lake levels are seen between May and July, which is also reflected in the record highs and lows, as they follow a pattern consistent with that of the average water levels. If the recent rise were to result in a new overall record maximum, it will likely occur in the spring and summer months. However, as stated before, water levels in the Great Lakes are complex, variable, and difficult to predict.
Management Next Steps
In the future, water level changes in Lake Erie should continue to be monitored. This will allow for continued analysis of regional trends and planning for future impacts. Monitoring both annual and seasonal trends in lake levels will allow for better understanding of regional changes, and more informed decision making and planning.
Prediction of future lake levels is very difficult, but updates and improvements to modelling techniques are constantly underway. Current evidence indicates that there will be an increase in the variability of lake level fluctuations (Gronewold and Rood, 2019). Because of this, it is important to consider possible impacts in periods of both high and low lake levels.
Changes in water levels in Lake Erie can have a variety of impacts. Higher lake levels can lead to an increased number of flooding events in coastal areas (Gronewold et al., 2016). Flooding can present safety hazards, cause erosion, and damage infrastructure (Meadows et al., 1997; Winters et al., 2015). Lower lake levels can present problems for shipping, as ships are forced to take on less cargo to account for decreased lake depth, causing economic losses (U.S. Department of Commerce et al., 2019; Sousounis and Bisanz, 2000). Habitats for wildlife and plants area also impacted by fluctuating lake levels, particularly those that rely on coastal wetlands for their breeding zones (Erwin, 2009). All of these impacts are important considerations for the management of Lake Erie.
References
- Deacu, D. V. Fortin, E. Klyszeijko, C. Spence, and P.D. Blanken. 2012. Predicting the Net Basin Supply to the Great Lakes with a Hydrometeorological Model. Journal of Hydrometeorology. 13: 1739-1759.
- Erwin, K.L. 2009. Wetlands and global climate change: the role of wetland restoration in a changing world. Wetlands Ecol Manage. 17:71–84.
- NOAA Great Lakes Environmental Research Laboratory, Great Lakes Hydro-climate Dashboard Project, https://www.glerl.noaa.gov/data/dashboard/data/levels/1918_PRES/.
- Gronewold, A.D. and R.B. Rood. 2019. Recent water level changes across Earth's largest lake system and implications for future variability, Journal of Great Lakes Research. 45:1-3.
- Gronewold, A., V. Fortin, B. Lofgren, A. Clites, C.A. Stow, and F.Quinn. 2013. Coasts, water levels, and climate change: A Great Lakes perspective. Climatic Change. 120:697–711.
- Gronewold, A. D., J. Bruxer, D. Durnford, J. P. Smith, A. H. Clites, F. Seglenieks, S. S. Qian, T. S. Hunter, and V. Fortin. 2016. Hydrological drivers of record-setting water level rise on Earth’s largest lake system. Water Resour. Res., 52:4026–4042.
- Hayhoe, K., J. VanDorn, T. Croley II, N. Sclegal, and D. Wuebbles. 2010. Regional climate change projections for Chicago and the US Great Lakes. Journal of Great Lakes Research. 36:7-21.
- Hunter, T. S. and T. E. Croley, II. 1993. Great Lakes Monthly Hydrologic Data. NOAA Data Report ERL GLERL, National Technical Information Service. Lofgren, B.M., and J. Rouhana. 2016. Physically Plausible Methods for Projecting Changes in Great Lakes Water Levels under Climate Change Scenarios. Journal of Hydrometeorology. 17: 2209-2223.
- Meadows, G.A., L.A. Meadows, W.L. Wood, J.M. Hubertz, and M. Perlin. 1997. The Relationship between Great Lakes Water Levels, Wave Energies, and Shoreline Damage. Bulletin of the American Meteorological Society. 78: 675-684.
- Quinn, F. H. and R. N. Kelley. 1983. Great Lakes Monthly Hydrologic Data. NOAA Data Report ERL GLERL-26, National Technical Information Service.
- Sousounis, P. and J. M. Bisanz. 2000. Preparing for a Changing Climate. The Potential Consequences of Climate Variability and Change: Great Lakes. University of Michigan, Atmospheric, Oceanic and Space Sciences Department.
- U.S. Army Corps of Engineers. 2019. Monthly Bulletin of Great Lakes Water Levels. Lake Erie Water Levels - October 2019.
- U.S. Department of Commerce, et al. 27 June 2019. “Great Lakes Ice Cover.” Ice Cover: NOAA Great Lakes Environmental Research Laboratory. www.glerl.noaa.gov/data/ice/#overview.
- Winters, B. A., J. Angel, C. Ballerine, J. Byard, A. Flegel, D. Gambill, E. Jenkins, S. McConkey, M. Markus, B. A. Bender, and M. J. O’Toole. 2015. Report for the Urban Flooding Awareness Act. 89 pp., Illinois Department of Natural Resources. http://hdl.handle.net/2142/78150.