THE RETIREES' NEWSLETTER
The Faculty and Librarian Retirees' Association, University of Windsor
Number 7, Apr/May, 1994
MINIMUM GUARANTEE PENSION VERSUS MONEY PURCHASE PENSION - Norm Shklov
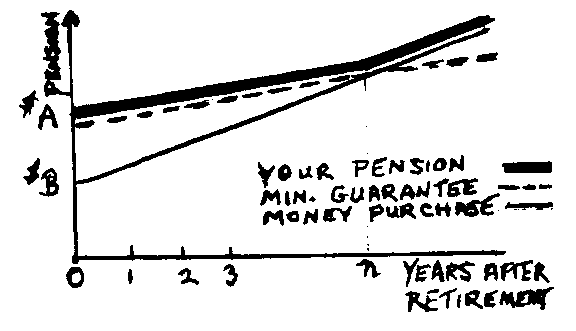
The typical pension history of a faculty or librarian retiree from the University of Windsor can be illustrated from the following graph.

The pension starts at $A, calculated by the formula (2% times the length of service etc.) which is part of the Pension Plan. It increases by a relatively small amount annually, related to the cost of living.
At the date of retirement, the total of the retiree's contributions and those of the University plus interest accumulated over the years, would buy him or her a pension of $B. This is usually less than $A. Hence, the retiree's pension starts out at $A. and continues as shown by the dotted line on the graph.
The solid line on the graph, starting at $B, illustrates the changes in the amount of pension which the retiree's accumulations could purchase over the years. The changes here are usually much greater than those in the upper graph, because they depend on the earnings of the Pension Fund, usually much higher than the increases in the cost of living. Thus this line increases much more quickly than the dotted one.
At some point, say year n, these lines cross. Then the amount of pension follows the solid line, the Money Purchase line. which increases at a faster rate.
Naturally, most retirees would like some idea of when this happens. Can we predict this? Can
we estimate n? A rough estimate can be obtained using some mathematics and a bit of "educated guessing".
Let n be the number of years before the two lines cross. Let x be the average annual rate of increase in the minimum guarantee line. Let y be the average annual increase in the Money Purchase line - the rate of return of the Pension Fund.
Then, the lines cross when
![]()
Solving for n, we have:

or
![]()
As an example, let us take A as $2000, B as $1500, x as 2%, and y as 8%. Then
![]()
This comes out to
n = log 1.33 / log 1.044 = .28518 / .05716 = 5 years approx.
It must be re-emphasized that this can never be more than an "educated guess" because of the difficulty of predicting x and y, the rate of consumer price increases and the rate of return on the pension fund. Nevertheless, if you have a good crystal ball, one that is fairly accurate in predicting these rates, you can come pretty close to estimating n.