
PROCEEDINGS OF THE LAKE ERIE IN THE MILLENNIUM BINATIONAL CONFERENCE:
PROGRESS AND NEW ISSUES
28-29 March 2001, University of Windsor
TABLE OF CONTENTS
Research Need #1. Factors Regulating Energy Flow in the Food Web-Workshop Findings & Predictions
RALPH E. SMITH
University of Waterloo, Dept. of Biology, Waterloo, ON N2L 3G1
Abstract
|
Recent analyses of trends in solar radiation failed to document a systematic clarification of the open waters of Lake Erie by dreissenids (zebra and quagga mussels) and/or nutrient controls, except for certain years in the west basin. It was apparent that tripton (i.e. inorganic suspended sediments), rather than phytoplankton or dissolved organic matter, was the dominant regulator of solar radiation in the lake. Decreased tripton concentrations and ongoing stratospheric ozone loss in the northern temperate zone were shown to contribute to increased ultraviolet radiation (UVR) exposure of organisms in the lake. To predict future trends, it was suggested that research was needed to address the factors regulating the quantity and quality of tripton in the lake, and to provide a quantitative basis for estimating possible impacts of UVR. Continued, and if possible increased, lake-wide surveys of optical conditions were recommended as necessary means of accounting for the spatial and temporal variability in the lake. Insufficient time has elapsed since the previous analysis to say whether the trends (or lack thereof) of solar radiation in the open lake have continued, and new survey results have not been published. However, additional evidence for the dominant influence of tripton on solar radiation has been produced, and tripton effects on UVR specifically have been better explained. Quantitative understanding of UVR impacts on the plankton has also increased. Some tools now exist to estimate both the gains and losses of planktonic primary and bacterial production that result from altered water clarity and stratospheric ozone depletion. Total UVR-dependent loss of areal primary production at present exposure levels in Lake Erie appears to be on the order of 10% for typical sunny summer days, but can range from 5 to at least 25%. Dreissenids are apparently continuing to increase their areal coverage on all substrate types, and should exert continued or increased pressure on phytoplankton, but effects on solar radiation climate are still hard to predict. Comparisons of nearshore with offshore stations tend to indicate that dressenids can produce spatial patterns in phytoplankton and nutrients within basins, but water clarity effects are obscured by other influences. There remains a need to know more about the factors regulating tripton in Lake Erie, the role of tripton and other properties of the water column as water clarity increases, and the impact of "mature" dreissenid communities on optical conditions in the water column. The spatial, as well as temporal, component of variation needs explicit attention on the within-basin scale. Recent developments in remote sensing techniques for inferring water clarity and particle loads should be pursued in coordination with sampling programs in the lake itself. The possibility of adaptive responses of the biota (including benthic organisms) to variations in photosynthetically-useful and ultraviolet radiation exposure should be examined, so that accurate predictions of biotic responses to changing solar radiation climate in the lake can be developed. At the Millennium Conference in April 1999, I was asked to address transient radiation. At the last meeting, good data were hard to come by. There is a heavy dependence on secchi and beam transmission. Notions of recent systematics causing an increase in water clarity are not well-supported by observations offshore, despite significant change in phosphorous and dreissenids. There is a minor influence of phytoplankton on optical conditions, but there is a major influence of tripton in suspended sediment measures. It appears that ultraviolet radiation is increasing. Research Needs as of 1999 We need to understand the regulation of tripton, especially regarding dreissenid influence. We need to understand the role of tripton in light climate. We need to quantify the consequences for the lake ecology (especially primary production). 0ptical surveys were conducted in 2000 and we made a number of new findings. Underwater radiometry further supports the dominant role of tripton in UV and visible light penetration (>90% explained variation with total suspended solids). For UV light, the tripton effect appears due partly to scattering but more importantly to positive associated correlation of tripton with the chromophoric intensity of DOM. Tripton is a marker for allochthonous and/or sediment associated organic matter of relatively high chromatophoric intensity. We now have better tools for measuring UVB. We have spectral wave functions for plankton. We can get an estimate of UV loss by 5-20% of UV is lost by tripton scattering as it penetrates the water. We are making progress on assessing the role of UV light in Lake Erie. The next step is to explore the food web implications: -What is the role of tripton in the lake? -Do we expect further change? -What about dreissenids? Last year we tried to assess the affects of the abundance of dreissenids based on distribution (Haltuch et al. 2000; Limnology and Oceanography 45:1778). We can do a spatial comparison by hand among areas lacking dreissenids. We can do a comparison of a nearshore station with an offshore station using data collected by the Department of Fisheries and Oceans. Chlorophyll a concentration is lower at the nearshore area than at the offshore area, which suggests a grazer impact at the nearshore area. If we look at light climate, attenuation coefficients are actually higher at nearshore than at offshore areas. If you look at the index of tripton concentration, there is more tripton at the nearshore stations. However, if you are looking for impacts of dreissenids, there probably are things to be looked at. Future Trends and Research Needs For future trends, I suggest that we still need to do more to look at suspended sediments in Lake Erie. We also have to look at DOM and address spatial aspects. Perhaps this could be achieved by remote sensing? We need to understand the adaptive responses of the biota on physiological, population, and community levels. The Saginaw Bay study showed a shift in energy flow from a pelagic to a benthic pathway. |
| Back to Top |
MURRAY CHARLTON
National Water Research Institute, Environment Canada, 867 Lakeshore Rd., Burlington, ON L7R 4A6
Abstract
|
Lake Erie has been sampled for over thirty years. Over that time, the nutrient load has been cut in half. In the latter part of the period alien species such as zebra mussels arrived and have kept arriving at about one new species per year. There was a big effect of nutrient controls in the west basin, and less effect in the central and east basins. Around 1995 there was a drop in phosphorous levels in the central and east basins. The low phosphorous concentrations have increased steadily from 1995 up to more than 10ug P/L. No explanation is forthcoming yet. Secchi depths and chlorophyll concentrations in offshore waters are at levels seen before the mussels arrived. For offshore waters, the major effect of the nutrient controls and the mussels was in the west basin. The causes of the recent nutrient perturbations need more research. When I started work in the 1970s, we had a paradigm that was 20 years out of date (GLWQA paradigm). A couple of months ago, I was asked about invading species. Currently, we have more than one invasive species discovered in the Great Lakes every year including two predaceous zooplankton species that have recently arrived. One of the questions that came out of the 1999 Millennium Conference was, "What are the mussels eating?" They are eating a lot besides algae. The bottom of Lake Erie is dynamic. Can the mussels survive on the energy stored in the lake bottom? One possibility is that the mussels will just run out of energy and eventually die out. I am going to begin with a review of simple water quality issues over the last few years. Nitrate has been increasing in Lake Erie for about 30 years (0.2 mg/L). There have been similar changes in the western basin. This is the largest man-made change ever made to a lake. It is completely out of control. This has the potential to alter N:P ratios. We have controlled phosphorous, but not N at all. Soluble reactive phosphorous (SRP) is hard to measure. The SRP should really be measured at time of collection on a ship. In the central basin, concentrations of SRP appeared to have decreased, but now levels are rising again. How do zebra mussels cause an increase in SRP high in the water column? There is considerable SRP in the midwater water column in midsummer. How does this happen? Is this a metabolic byproduct? Are mussels consuming so much energy that plankton can't keep up? Secchi Depth (offshore) There has been an increase in the offshore secchi depth as a result of water quality cleanups, but even at worst, the central basin wasn't that bad. In the western basin, there has been fundamental change [secchi depths are much greater than previously]. This change is consistent with the mean depth effect. There are more mussels/volume of water here than in the central or east basins. This changes the resuspendability of sediments, but this effect doesn't transfer to a whole lake basis, except close to shore. Chlorophyll a In the central basin, we are seeing chlorophyll a concentration increasing at a level that was typical prior to the introduction of zebra mussels. In 1970, the annual mean was about 5.5 mg/L, which is not high. The present levels are not much lower. In the western basin, where we have most of the nutrient loadings, we have more change [a greater reduction in numbers], and perhaps mussel effects are being seen. Money was well spent on pollution control. Lakewide productivity is a function of chlorophyll a. In the openwater area of most of Lake Erie, chlorophyll a levels have not changed, so zebra mussels may not be the culprit. Total Phosphorous for the Three Basins In the eastern basin, phosphorous concentration went down and then it started to increase about 1995, and has continued to increase. In the western basin, levels are still increasing, and the same amount of change is happening over the whole lake. There is a lack of data that can be used for estimating fundamental loadings to Lake Erie. We need this to understand the reason for the phosphorous increase. It is a crime that we do not have this data. In our careers, we have only looked at conditions during high water periods. Presently, we're at the lower end of the high water levels, and we can expect a further decline in water levels even in the absence of global change. We can expect this to have many limnological effects (e.g., low oxygen because of smaller hypolimnion). In August 2000, dissolved oxygen (DO) near the bottom was very low, similar to 1970 levels. Back then this was a warning sign that there may be a problem. Are we seeing a recurrence? Overall, we have lost a bit of chlorophyll a, but not much. On other hand, there are lots of fish in Lake Erie. In the eastern basin, during years with small thermocline depressions, we have little oxygen depletion. When we have a deep thermocline depression (i.e. more depletion in deeper water), oxygen depletion is a problem. |
| Back to Top |
LAKE ERIE PLANKTON AT THE MILLENNIUM PLUS ONE: PROCESSES AND PROBLEMS
DAVID A. CULVER1, Erin Haas1, and Murray Charlton2
1Department of Evolution, Ecology, and Organismal Biology, The Ohio State University, Columbus, OH 43210, USA
2National Water Research Institute, Environment Canada, 867 Lakeshore Rd., Burlington, ON L7R 4A6
Abstract
|
Since 1970, decreased phosphorous and increased nitrogen input have affected the functioning of the Lake Erie pelagic ecosystem (including algal, zooplankton, and fish abundances), even before the introduction of dreissenids further altered biological balances in the lake. Previously, we reported May-August mean algal biomass (mg wet weight/L) in the western basin declined from 5.3 (1970) to 2.0 (1985) to 0.9 (1995-97). Algal biomass data for the central and eastern basins for these years were 3.1, 1.0, and 0.7 and 2.3, 0.4, 0.4, respectively. While we do not yet have algal counts from 1998-2000, chlorophyll measurements from all three basins suggest that algal abundances have increased recently. The cyanophyte blooms dominated by Aphanizomenon and Anabaena that were so common in the 1970s have abated, with Chrysophyta and Cryptophyta dominating in 1996-97 in the western basin (67% and 21%, respectively). Central basin algae were dominated by Chrysophyta (55%), Cryptophyta (24%), and Pyrrhophyta (10%). Nevertheless, major blooms of toxic strains of Microcystis occurred in the western basin in 1995, 1998, and 2000, suggesting that phosphorous and ammonia availability may be increasing. Various lines of evidence suggest that zebra mussel excretion of phosphorous and nitrogen has increased nutrient content of the lake, at least in the western and west central basins. The highest algal concentrations occur in areas of agricultural runoff (e.g., at the mouths of the Maumee and Sandusky Rivers), municipal discharge (e.g., around the Bass Islands and near Cleveland), and in areas where frequent upwellings bring nutrient-rich water to the surface (e.g., east of Long Point). If zebra mussels are responsible for the recent cyanophyte blooms, their expansion over soft sediments suggests that Lake Erie algal blooms may continue to increase. In effect, increased internal loading of nutrients will counteract progress made in limiting external loading. Zooplankton biomass has changed as well. While crustacean abundance was fairly constant from 1996 through 1999 in all three basins, samples collected in 2000 showed a 40% increase in the western basin relative to 1999, and a 100% increase in the central and eastern basins. The increased contribution of rotifers, and especially dreissenid veligers, to the total zooplankton community has been particularly noticeable in samples from 2000. Biomass does not tell the whole story, of course, and we are anxious to make calculations of secondary productivity for these samples, and estimate changes in grazing rates and nutrient excretion rates by the different components of the zooplankton. Better understanding of the role of turbulent mixing on the impact of benthic zebra mussels on pelagic algae is required. We also need much more information on spatial distribution and size distribution of zebra and quagga mussels, particularly as they expand to low turbulent energy, soft substrates. Most of our data on phytoplankton distribution are from surface samples, whereas it is clear that highest concentrations may be far below the surface. At the same time, distribution of plankton and nutrients from the inlets from the major western basin inlets (Detroit, Maumee, and Sandusky Rivers) profoundly affects the patchiness of the plankton, which we blithely sample based on fixed sites. Remote sensing of chlorophyll distribution will enable us to better model variation in surface algal abundance under the influences of rivers, cities, and upwelling events. Measurements of seasonal variation in phosphorous, nitrogen, and silica loadings are needed desperately for the modelling efforts, at a time when information is becoming increasingly scarce, particularly for the Detroit River. Phosphorous has increased, but chlorophyll a levels have stayed the same. We hope that the same processes will apply on the Canadian and US sides. The stations sampled vary from year to year. However, zooplankton data analyses show that small and large data sets give similar estimates (within 5%). Data from Makarewicz et al. (1999), indicate that phytoplankton abundances have consistently decreased through time. Zooplankton numbers haven't declined to the same extent, partly because some of the phytoplankton losses were large filamentous diatoms, and toxic bluegreens which may not have been edible. For the last 2-3 years we have had large increases in zooplankton abundance. In 2000, we had lots of zooplankton. We must try to determine what the possible interactions are within the whole ecosystem that might explain Murray Charlton's water quality data and our biological data. Haltuch et al. (2000) suggests that the area covered by dreissenids has increased, and that mud and mud zones have had the greatest increases in coverage because hard substrates are pretty well covered already. If we extrapolate these data across the whole lake, 21% of the hard substrate is presently covered by dreissenids, and it is increasing by 4% per year.
|
Table 1. Summary of observations from Lake Erie, 2000.
| PARAMETER | PATTERN |
| Water clarity (secchi depth) | Constant |
| Chlorophyll a | Constant |
| Phosphorous | Increasing |
| Zebra mussel populations | Increasing |
| Zooplankton biomass | Increasing |
|
Many processes are nonlinear functions of depth and biomass. Primary productivity is a nonlinear function for chlorphyll a concentration, depending on light. Zooplankton grazing can alter phyolankton dynamics. Zooplankton excretion can increase the internal loading of phosphorous and ammonia at various depths. Zooplankton production is not equal to biomass. P daphnia – (Daphnia production)=0.0523 x (Daphnia biomass)0.8 We have put together data with our knowledge of excretion rates of mussels and their grazing rates as a function of abundance. We also used 32P3 tracers. From this we see a curious result. Although zebra mussel grazing rates cause excitement, their overall levels are much lower than total zooplankton clearance rates, because zooplankton are everywhere and zebra mussels occur only in the nearshore. However, veligers are taking on an increasing role. There are more problems in making calculations in the central and eastern basins due to their greater volume and the difficulty relating cubic measures to square measures. If you look at the excretion rates of N and P for zebra mussels and compare them to excretion rates of N and P for crustaceans, etc. the amounts for zebra mussels are extremely high, and quite a bit higher than for crustaceans (using Haltuch's estimate). Therefore, zebra mussels are much more important in terms of resuspending nutrients than they are for removing chlorophyll a from the water column. The seasonal averages mask short term biotic dynamics. The temporal distribution of rainfall affects the external N and P which enters Lake Erie. Physical transport affects spatial distribution of these nutrients. This has important implications for fish recruitment for fish recruitment dynamics. The timing of N and P loading varies, depending on rainfall. Also drought years must be taken into consideration. The Landsat 7 image showing diversity of movement of tripton. Using this we can track shipping trails and algal plumes from Sandusky Bay and match Hexagenia patterns to some important event This 1996 graph shows the relationship between juvenile fish and zooplankton abundance. Diet switching times are important in the general success of fish. The main surveys were completed in mid to late August, but well past the time that YOY have switched from feeding on zooplankton to benthos consumption. We should relate fish recruitment to June zooplankton abundance. We can't look at seasonal averages. References Haltuch, M.A., P.A. Berkman, and D.W. Garton. 2000. Geographic information system (GIS) analysis of ecosystem invasion: Exotic musssels in Lake Erie. Limnology and Oceanography 45(8):1778-1787. Makarewicz, J.C., T.W. Lewis, and P. Bertram. 1999. Phytoplankton composition and biomass in the offshore waters of Lake Erie: Pre- and post- Dreissena introduction (1983-1993). Journal of Great Lakes Research 25(1):135-148. |
| Back to Top |
MICROBIAL PROCESSES INVOLVED IN NUTRIENT AND ENERGY FLOW THROUGH THE BASE OF THE FOOD WEB IN LAKE ERIE
ROBERT T. HEATH and Xueqing Gao
Department of Biological Sciences and Water Resources Research Institute
Kent State University, Kent, OH 44242
Abstract
|
How are sunlight, carbon dioxide and inorganic nutrients converted into fish food? Research during the past decade has increased awareness of the significance of the microbial food web (MFW) in the transfer of nutrients and metabolic energy through the base of the food web in Lake Erie plankton communities. Recent research questions the views, traditionally held, regarding energy and nutrient dynamics in plankton communities, points to the need to identify as yet unrecognized prokaryotic species, and identifies new questions that need to be addressed. These changes are likely to alter the direction of management and management-oriented funding agencies, as they seek to identify indicators of ecosystem and community health. The traditional, Lindeman-esque view of energy dynamics considers that because phytoplankton photosynthesis is virtually the sole source of metabolic energy, phytoplankton alone are significant carriers of energy to be delivered to higher trophic levels primarily through grazing by large-bodied microcrustaceans (grazing food chain, GFC). What photosynthate may be released from phytoplankton as dissolved organic carbon (DOC) is viewed as lost from availability to higher trophic levels, being respired by bacteria. Recent techniques have led to a series of investigations that question the universality of this view. Radiometric techniques have permitted a comparison of the rate of phytoplankton production, estimation of the portion of photosynthate released as labile DOC, and the rate of bacterial production in these communities. The advent of epifluorescence microscopy and fluorometric techniques has allowed enumeration of bacteria, estimation of the portion of bacteria that are alive (i.e. respiring), identification of bacterivorous predators (e.g., protists and rotifers), and estimation of the rate of bacterivory. Taken together, these studies indicate that alternate pathways of energy flow through the MFW may be significant and rival the energy flow through the traditional GFC in certain habitats and under certain conditions. Energy flows from phytoplankton through both the GFC and MFW, but these two pathways are not equally efficient. The efficiency of energy transfer through the MFW and the factors that control it are poorly understood. Most likely, the efficiency of energy transfer through the MFW is lower, possibly much lower, than transfer through the GFC because of the multiple trophic links through which energy passes in the MFW. Therefore, the relative efficiency of energy transfer from phytoplankton to zooplankton required an accounting of the relative amounts of energy passed through the GFC and the MFW. Recent studies in Lake Erie indicate that the MFW is more important in communities containing phytoplankton that are poorly grazed by microcrustaceans (e.g., communities dominated by cyanobacteria), and it is more important in offshore than in nearshore communities. Nearshore and offshore communities differ in taxonomic composition seen from denaturing gradient gel electrophoresis (DGGE) analysis of polymerase chain reaction (PCR) amplified rDNA genes, but the identity of these taxa is largely unknown, and the significance of these taxonomic differences is not clear. These findings indicate that future research on Lake Erie needs to concentrate on issues related to the structure and function of the MFW, especially as they may change along a nearshore-to-offshore axis. Many fundamental questions need to be addressed. Bacterial taxa, their distribution and abundance, and the factors that control their population size and growth rates need to be examined. Of particular importance is a continued evaluation of the relationship between phytoplankton production and bacterial production. Management scenarios need to re-focus from phytoplankton production per se and focus instead more broadly on the efficiency of energy flow from phytoplankton to zooplankton. Related to this, research needs to identify those factors that alter the ratio of energy flowing through the GFC and the MFW. Accordingly, management agencies and management-oriented funding agencies need to focus their efforts on activities in the MFW, and those factors that may alter bacterial activities (e.g., bacteriophage, organic eutrophication), and rates of bacterivory. The simple picture of the transfer of CO2 to algae and then to zooplankton sticks well in our mind, but we don't think about other things. We base our plans on what we can see. The perceived issues are that phosphorous and the factors that control it are paramount in determining the energy base. Phytoplankton nutrition determines the basis of zooplankton nutrition and ecosystem health depends on phytoplankton and nutrients. However, we also need to consider the other features. Algae release dissolved organic carbon (DOC). We have to consider if this release is constant or varying. Bacteria can form the link between DOC and CO2. The traditional view is that bacteria are the grand mineralizers. We could also run the phosphorous model and would see that bacteria may mineralize phosphorous, too. We must remember that bacteria are eaten as well. It is hard to observe, so it gets overlooked. We needed live counts to assay bacteria until recently. We require Nemarsky optics to follow grazing rates, and we need epifluorescence microscopy. Only in the last decade have we been able to quantify rates of bacterivory. Now the picture has become more complicated. Now we realize that there are two different ways for CO2 to become zooplankton (fish food). This can occur through traditional food web transfer or through the microbial food web. If relative rates were constant, we could tweak current food web models, but what if there's temporal or spatial variability? The nearshore and offshore communities differ quite a bit. The denaturing gradient gel electrophoresis (DGGE) pattern shows bacterial structure differed widely. We can evaluate proteobacteria and cytophaga/flavobaceria production through in situ hybridization (Table 2). Table 2. Primary production, bacterial production, and dissolved organic carbon percentages in nearshore and offshore areas of Lake Erie.
|
| Nearshore | Offshore | |||
| Primary Production | % DOC | Primary Production | % DOC | |
| Early | 3.24 | 16% | 0.92 | 9% |
| Late | 19.68 | 67 | 49% | |
| Bacterial Production | Bacterial Production | |||
| Late | 1.98 | 394% | 0.035 | 42% |
|
We see that the relative sources of production in Lake Erie vary a lot from nearshore to offshore. The same can be said of protista. Protists graze at different rates. Ciliates graze at rates 10 times faster than protists. There are 10 times fewer ciliates than flagellates, so total production numbers are often about the same, especially in the nearshore versus offshore areas. Carbon flow to microcrustaceans. There are mostly phytoplankton in the nearshore area and mostly protists in the offshore area. But overall there is much less offshore (0.37) than nearshore (4.51) carbon production. In nearshore areas, algae are far and away the primary contributors to production. But in the offshore, the situation can be different, especially late in the season. Future Trends and Research Needs We need a better understanding of the relative contribution of the grazing food web and the microbial food web to carbon flow through the base of the food web. There is an overall efficiency of the base of the food web but nearshore and offshore communities differ. Ecosystem health needs to be judged in terms of energetic efficiencies. We need to focus on factors that influence the microbial food web function (e.g., influence of viruses on other microbes). We have to consider Murray Charlton’s comments. Organisms are present at 1 million per millilitre. |
| Back to Top |
ZOOBENTHIC FAUNA OF LAKE ERIE: CONTINUING PATTERNS OF CHANGE
TREFOR B. REYNOLDSON1, R. Dermott2, K. Kreiger3, and J.J.H. Ciborowski4
1NWRI, Environment Canada, 867 Lakeshore Rd., Burlington, ON L7R 4A6
2GLLFAS, Fisheries & Oceans Canada, 867 Lakeshore Rd. Burlington, ON L7R 4A6
3Heidelberg College, Water Quality Laboratory, 310 East Market Street
4University of Windsor, 401 Sunset Ave., Windsor, ON N9B 3P4
Abstract
|
Most attempts to understand the response of the benthic macroinvertebrate community to change in the Great Lakes have been based on infrequent but spatially extensive surveys. Although synoptic studies show the distribution of the benthic community at the time of sampling, few researchers have attempted to put the changes observed among synoptic survey periods into the context of normal seasonal or inter-annual variability. Typically, any marked changes observed among years in intermittent studies are interpreted as direct community responses to environmental perturbation. However, the variation may simply represent normal temporal fluctuations in the populations comprising the community. A monthly sampling program has been in place through Environment Canada at one station in each of Lake Erie's 3 basins since 1987 - a profundal stratified location (eastern basin; depth 45 m), a shallow stratified location (central basin; depth - 23 m), and a shallow unstratified station (western basin; depth 10 m). The use of these three habitats has allowed delineation of the relative importance of temporal variation in the context of spatial variability. We compared the patterns (families of benthos) observed in this temporally intensive, site-specific study with periodic, spatially-extensive studies conducted in the eastern and western basins and along the south shore of the central basin. For the temporal-trend analysis, benthos were sorted and identified from five 25 cm2 cores extracted from a 0.25 m2 box core sample collected monthly between April and October. Here, we report on trends revealed by multivariate analysis of data processed for the period 1987-1994, and 1998 - a total of 168 samples (7 months x 8 years x 3 basins). The community composition of eastern basin samples was compared with the results of Ponar grab samples collected from 3-6 sites in nearshore Lake Erie (depth 5-15 m) and 5-8 locations in the profundal zone (depth >30 m) in 1992/93 and 1998. Compositional similarity among 25 cm2 core samples was estimated using the Bray-Curtis, metric. Non-metric hybrid multi-dimensional scaling (HMDS; Belbin 1991) was then used to ordinate the samples in multivariate space to reveal temporal patterns in community change. A separate ordination analysis was performed on the data from each of the basins. The establishment of dreissenid mussels in Lake Erie is argued to be one of the single most significant changes to benthic community structure in the Lake's history. To determine whether the appearance of Dreissena comprised a modification of deep-water community composition or merely an addition, we determined what the position of the 1992, 1993, and 1994 year-averaged samples would be in ordination space with the Dreissena data removed. A total of 26 invertebrate families were represented from monthly core sampling from 1987-98. Only seven of these families were present in more than 10% of the samples, and more than half occurred in less than 3% of the samples. The central basin site had the lowest richness (8 families). The western basin location had the lowest density but the greatest macroinvertebrate richness (16 families). Twelve families were collected at the east basin site. The assemblages of zoobenthos in each basin were quantitatively different. In all three basins, the most abundant five families were the same and in the same order of abundance, which in decreasing order was: Tubificidae, Naididae, Dreissenidae, Chironomidae, and Sphaeriidae. However, only Tubificidae, Naididae, Pisidiidae, and Chironomidae were present in more than 50% of the samples. These families were also among the five most numerically abundant. Tubificidae was the most abundant family in all three basins. Hexagenia mayflies (Ephemeridae) have become abundant in the west basin since the mid-1990s, producing a time-averaged density of 4x101/m2. Emergences of adult Hexagenia have been reported at points on the shoreline of all three basins in both Canada and the US. However, very nymphs have been reported from synoptic surveys in the central basin. Eastern basin samples are characteristically dominated by tubificid and naidid worms, resulting in a community composition quite distinct from central and west basin samples. Spatially extensive surveys conducted in 1992/93 and 1998 suggest that densities of Diporeia in the late 1990s are dramatically lower than was observed in the earlier survey. However, the time series of cores from the centre of the eastern basin failed to detect this decline, largely because densities of Diporeia have never been very high in core samples at that location. Central and west basin samples tended to intergrade in community composition, suggesting that these basins support a continuum of communities. Sphaeriids were more common in central basin samples, whereas Ephemeridae were collected only in west basin core samples. Relatively low densities of dreissenids (primarily zebra mussels, Dreissena polymorpha) were present in nearshore waters of eastern Lake Erie in 1992. However, by 1993, densities had risen to over 5,000 per m2, with quagga mussels (Dreissena bugensis) predominating over zebra mussels in a 2:1 ratio. Densities of quagga mussels in 1998 were unchanged from 1993, but zebra mussel densities had declined to about two-thirds of their former abundance. Gammarus amphipods in nonstratified areas of the eastern basin are becoming supplanted by the Ponto-caspian amphipod invader Echinogammarus ischnus. Overall, the presence of dressenids in the profundal zone of eastern Lake Erie has not influenced the density of other taxa. Five families contributed to observed patterns of community composition in the central basin - Tubificidae, Naididae, Sphaeriidae, Valvatidae, and Dreissenidae. Dreissena were first observed in core samples in fall 1989, and high densities became established in spring 1991. The benthic community of the central basin has increased in richness (especially species of Gastropoda) since establishment of dreissenids in the central basin. Emergences of adult Hexagenia mayflies have been reported along the southern shore of the central basin since 1998. Eight families contribute to observed patterns in core samples from the western basin. Dreissenia was first observed in 1990. Temporal associations suggest strong local interactions between Dreissena and several other families (e.g., Gammaridae, Physidae, Hydridae, Glossiphoniidae), which have appeared at the western basin site since 1994. However, these appearances more likely reflect the cessation of periodic episodes of anoxia than a specific association with zebra mussels. Indeed, western basin dreissenid densities are high primarily near shorelines, at reefs, and around protected islands. Thus, the changing community composition most likely reflects a limnological trend from eutrophy to mesotrophy. In the western basin, there has been a decline in overall numbers of tubificids, naidids, and sphaeriids, but an increase in richness, and the appearance of four gastropod families, gammarids, leptocerid caddisflies, and Hexagenia, all of which characterized the western basin's benthic fauna prior to the 1950s. Hexagenia occupies most of the western basin except for Pigeon Bay (west of Point Pelee), and a broad band extending from the mouth of the Detroit River eastwards through the centre of the basin. Macrobenthic communities in all basins are changing. Richness is increasing across the lake as a whole. Densities of oligochaetes are in decline. Molluscan community diversity is increasing, but sphaeriid populations are in decline. The prediction of an extinction of Diporeia made at the 1999 Lake Erie at the Millennium conference is unlikely if Diporeia is indeed an incidental, as the profundal benthic cores suggest. The prediction of the replacement of Gammmarus by Echinogammarus can't be tested by examining data from the centre of the three basins. However, the core data do suggest that sphaeriids may eventually disappear. There is no evidence that the rate of change of benthic community composition in Lake Erie is slowing. Predictions Spatially extensive sampling suggests that Diporeia is in great decline and likely to disappear. Temporal trend data suggest that although abundances are low, they have never been very high in some locations. Sphaeriidae numbers are in decline, and these organisms may disappear. However, temporal trend data indicate that their numbers were in decline prior to expansion of dreissenid populations. Densities of Gammaridae are increasing in the east and west basins. Echinogammarus may replace Gammarus in shallow-water zones. Densities of Chironomidae have been predicted to decrease as all basins tend towards oligotrophication. Temporal trend data show no change in density at the family level. The range of Hexagenia mayflies is predicted to continue to expand into regions where muddy sediments occur above the zone of stratification in all three basins. Hexagenia may displace quagga mussels from these zones. Overall zoobenthic diversity will continue to increase. Future Trends and Research Needs We must achieve a better understanding of the trophic and nutrient transfer implications of the observed changes in benthic community composition. In explaining the energy flow patterns of Lake Erie, we must consider the differences among the three basins, especially the partitioning and nature of primary food sources. These differences are greatest between the east and west basin. Are the changes seen in the zoobenthic community due to physical change or food resource changes? Are the trends that we are seeing 'pulse' responses to single events or do they represent an ongoing directional change in response to evolving conditions? What is the likelihood of the zoobenthic community achieving some sort of steady state? We must recognize that we cannot distinguish true change from random variation from data that consist entirely of intermittent, synoptic sampling. |
| Back to Top |
STATUS OF FISH STOCKS IN LAKE ERIE - AN UPDATE
Stephen J. Nepszy1,3, Andy Cook1, Timothy B. Johnson1, Don MacLennan1, Larry Witzel2
1 Ontario Ministry of Natural Resources, Lake Erie Fisheries Station, R.R.#2, 320 Milo Road,
Wheatley, ON N0P 2P0
2 Ontario Ministry of Natural Resources, P.O. Box 429, Port Dover, ON N0A 1N0
3 Emeritus Research Scientist
Abstract
|
Fish production has declined in many parts of Lake Erie during the past few years and remains at levels lower than in the past. This decline has been due principally to food web effects; reduced lake productivity; declining growth; recruitment and survival in a number of species; increased exploitation; and habitat degradation. The lakewide decline in abundance and biomass of key functional groups is associated with a reduction of warmwater omnivores. Abundance and biomass of exploited species such as yellow perch, walleye, and rainbow smelt have generally declined. Although some new modelling approaches for yellow perch populations suggest recovery in some perch populations, there is still much uncertainty. Exotic species abundance has also declined although there is a reversing trend as round goby populations continue to increase in the central and eastern basins of the lake. Advances have been made in hydroacoustic assessment, gear selectivity work and different approaches to spatial and habitat modelling and analyses. Attempts are being made to address ecosystem effects through new innovations such as the use of stable isotopes, multi-species food web models and stock discrimination studies. Studies of the bioenergetics of top predators such as lake trout, walleye, and yellow perch are at various stages of completion. Continuing research and assessment needs include the following: consideration of the changing habitat in relation to fish production; effects of changes in the physical environment on index/survey gear selectivity and catchability; the role of wetlands and tributaries to lakewide production and a greater consideration of the entire fish community. Walleye
In 2000, commercial fishermen reported the lowest harvest of walleye since 1983. Catch rates for walleye have declined in both the commercial and sport fisheries. The catch per unit effort has dropped quite dramatically. Walleye abundance is generated from catch at age analysis (CAGEAN). The Ontario Ministry of Natural Resources has changed to a new methodology called ADMD. We don't have an exact basis for comparison yet ADMD is similar but not identical to CAGEAN. This pooled survey generates catch per unit effort and shows a decline in walleye abundance since 1990 that is continuing. There is considerable interest in recruitment as the last strong year class of walleye was recorded in 1996. The 1999 year class looks good, but 2000 is very weak, so some indicators show continued decline. For the near future, the percid management strategy will be a 3-year conservative harvest to protect the fishery.
Yellow Perch
Yellow perch is managed in 4 different areas across Lake Erie. In 2000, the harvest totaled about 6.1 million pounds, roughly a 6.1% increase from 1999. There were minor increases in management units 1,2,3 and some decline in management unit 4. In terms of catch per unit effort in the various basins, gill net harvest increased dramatically in all basins, but sport catch harvest declined. From the Index Fishing Survey, the abundance estimated from modelling the system, suggests that there has been an increase over all 4 quarters of 2000, but this could be due partly to the new system of modelling. The recruitment indicators show a strong 1996 year class for yellow perch. The recruitment in 1997 and 1998 was okay but the last 2 years have been weak. This leads us to recommend continued conservative exploitation leading to stock sustainability. Therefore, there will be a low harvest limit next year.
Rainbow Smelt
The Rainbow smelt harvest has continued to decrease, but it was much lower last year than previously. In the past the quota was not used because of new competing species in Japanese market. There has also been a complete lack of recruitment in last couple of years. The 1998 year class was strong but the 1999 and 2000 year classes were very weak in the east basin. Lake Whitefish Total harvest in 2000 was 1.3 million pounds. Ontario takes 97% of the total harvest by gill nets with Ohio taking the remaining 3% in trap nets. The catch per unit effort shows a decline last year, which is cause for some concern. The declining status in catch per unit effort in the annual index survey indicated a decline below last few years' average. The condition of mature males and females is quite poor, and this is perhaps diet-related. The Lake whitefish diet is currently primarily chironomids, whereas in the past Diporeia was an important food source. There has been a fair amount of lake trout stocking in the eastern basin, but overall indices show declines in adults and juveniles since 1998, which is cause for concern.
Burbot
Burbot has been increasing in the eastern basin commercial harvest since 1998. There is a correlation with this increase and the recovery of Lake whitefish stocks, which has raised a concern of community interaction with other species.
Prey Fish In the western basin, total abundance seems to have increased in the last year due to alewife, young-of-the-year (YOY) emerald shiners, rainbow smelt, and gizzard shad. There have been declines in the central basin over time accompanying the appearance of gobies and their increasing importance in the diets of western and central basin piscivores. The overall picture of the eastern basin is a decline in prey fish abundance. There are huge increases in goby numbers and a corresponding increase in their component of the piscivore diet, especially largemouth bass. The lakewide distribution of gobies has shown huge numbers in 2000. Although sampling areas on the north side appear blank it is because of difficulties with trawling due to substrate type. The small-mesh index gill net catches show similar increases in the population, with more evidence that the goby is a species of major importance.
Future Trends and Research Needs We will be completing a hydroacoustic assessment of Lake Erie. We will be performing some gear selectivity work (trawls versus acoustics). We will also be performing some spatial/habitat modelling and some other spatial analyses for yellow perch and walleye. The reward tag program for walleye is continuing and we have recently implemented the Ecosystem Effects programs which will study stable isotopes, multi-species food web models, stock discrimination of walleye, and bioenergetics of top predators. Future research needs include gaining an understanding of changing habitat and it’s impact on fish production and distribution. We will continue to look at zebra and quagga mussel effects on the system as well as recognizing the effects of environmental changes on the index/survey data. We will begin looking at linking the land-water interface (watershed science) and gaining a greater consideration of entire fish community. |
| Back to Top |
CANADIAN TRENDS IN LAKE ERIE COLONIAL WATERBIRD POPULATIONS
CRAIG HEBERT1, Chip Weseloh2, Cynthia Pekarik2 and Laird Shutt1
1Canadian Wildlife Service, 100 Gamelin Blvd. Hull, QC K1A 0H3
2Canadian Wildlife Service, 4905 Dufferin St., Downsview, ON M3H 5T4
Abstract
| Fish-eating birds are an integral part of the
Lake Erie ecosystem. In this paper, we discuss recent research findings
regarding two species: the double-crested cormorant (Phalacrocorax auritus) and
the herring gull (Larus argentatus). We also discuss future trends and research
needs.
Populations of cormorants on Lake Erie have increased greatly during the last 30 years (Figure 1). |
Figure 1. Temporal trends in Lake Erie
double-crested cormorant populations, 1970-2000.
|
This increase was probably the result of a number of factors. Laws prevented human persecution of the species, reductions in the levels and effects of toxic chemicals in the Great Lakes allowed reproductive success to improve, declines in native predator fish as a result of human over-fishing and lamprey predation lead to an abundant supply of prey fish. In recent years, cormorant populations in eastern North America may have also benefited from the expansion of commercial fish farms in the southern United States. Coinciding with the increase in cormorant populations has been the perception that cormorants are responsible for the decline in many Great Lakes fisheries. To assess the impact of cormorants on individual fish species we modified a model initially designed to estimate total fish consumption by waterbirds in the western basin of Lake Erie (Madenjian and Gabrey 1995). Using this model, the consumption by cormorants of three species of fish (walleye (Stizostedion vitreum), yellow perch (Perca flavescens), rainbow smelt (Osmerus mordax)) was estimated. Cormorant census information from both 1991 and 1999 were used to examine changes in predation pressure through time. To put the fish consumption estimates into context, we compared the cormorant consumption estimates to fish harvest statistics for Canadian waters of Lake Erie. In 1991, cormorants were estimated to have consumed 1.94 x 10⁵ kg of walleye, 5.5x10⁴ kg of yellow perch, and 3.8x10³ kg of rainbow smelt. When compared with the 1991 commercial harvests of these species, cormorants consumed the following equivalent percentages: walleye 6.9%, yellow perch 2.7%, smelt 0.04%. In 1999, consumption estimates increased to 7.26x10⁵ kg for walleye, 2.04x10⁵ kg for perch, and 3.5x10⁴ kg for smelt. Compared to the 1998 commercial harvests of walleye, yellow perch, and smelt, cormorants consumed equivalent percentages of 15.5%, 11.5%, and 0.6%, respectively. These results indicate that cormorant consumption of commercially important fish species has increased, but the significance of this predation on commercial fish stocks remains to be determined. The expanding cormorant population also poses a threat to other ecosystem components. In the western basin of Lake Erie, cormorants nest on islands that contain some of the most unique plant communities in Canada. Cormorant populations on many of these islands have increased greatly during the 1990s. Recent surveys of East Sister Island (ESI) have noted detrimental effects of cormorant guano on native vegetation. The apparent effect of cormorant nesting on the ESI plant community is cause for concern. Other islands in the western basin archipelago have similarly unique plant communities and may suffer as cormorant populations on those islands increase. Long-term declines in the most abundant pelagic prey fish population in the eastern basin of the lake, the rainbow smelt, have been documented. Given the importance of smelt to piscivorous predators in Lake Erie, smelt population trends may have important ramifications for fish-eating birds. Analysis of stable nitrogen and carbon isotopes in herring gull eggs indicate that the diet of Lake Erie herring gulls has changed through time (Figure 2). |
Figure 2. Temporal trends in stable nitrogen isotope values in herring gull eggs from Lake Erie, 1982-2000.
|
In the eastern basin, gull egg isotope values differ among years. When smelt are less abundant, egg isotope values are more similar to the isotopic signatures found in terrestrial food. These changes in the proportion of aquatic versus terrestrial food in the gull diet may be indicative of reductions in aquatic food availability forcing the birds to rely on foods derived from terrestrial sources. Because herring gulls are opportunistic piscivores they can switch their diet when fish availability declines if other high quality prey is available. However, pathways of energy flow (aquatic versus terrestrial) to herring gulls in eastern Lake Erie seem to have changed. These changes may be providing us with an initial indication of ecosystem stress manifested through decreased production of pelagic fish. Another recent development in Lake Erie was the outbreak of Type E botulism in 1999 and 2000 [see abstract of poster presentation by Campbell et al. Ed.]. Thousands of birds (mostly piscivores) and other wildlife died as a result. The causes for these outbreaks need to be investigated. We looked at fish consumption in Lake Erie by cormorants. Heather Morrison was an important contributor in this work. The estimated consumption in 1991 was 1.94x10⁵kg versus 7.26x10⁵ in 1999; yellow perch 5.5x10⁴ to 2.04x10⁵kg. We then can compare these numbers to the amounts harvested by the commercial fisheries. In 1991, 7% of the walleye commercial catch was consumed by cormorants. In 1999, the amount had increased to 16%. In 1999, yellow perch consumption by cormorants had risen from the equivalent of 7% in 1991 to 12%. From this, we need to ask the question, is this increase significant with respect to the commercial fishery? Another issue regarding the increasing population of cormorants that is important, yet receiving less attention, is that most cormorants are nesting on western basin islands. Cormorant guano kills trees and other species on islands that contain many of the rarest species in Canada. For example, there are 40 rare species on Middle Sister and East Sister Island that are being impacted by 6,000 cormorants on each island. Most of the increases have occurred since the mid 1990s. The Middle Sister Island population of cormorants appeared in 1999. Given the known effects on other islands, we expect similar results on these other islands (i.e. loss of unique plant communities). We expect a continued population increase and accompanying fish consumption increase by cormorants. There will probably be continued loss of biodiversity on the Lake Erie islands, especially the northern intolerant plant species at the northern extent of their range. Herring Gull Data The number of herring gull nests has declined through the 1990s. The cause is unknown. However, we have seen a change in diet composition. We have examined the present and archived samples of gull eggs through N stable isotope analyses. Both Lake Erie basins show steady decline in 15N delta signatures, i.e. gulls are feeding at lower levels in the food web. The amount of 15N positive asymptote of the number of rainbow smelt per trawl reflects a greater proportion of diet from terrestrial sources as fish abundance declines. We are estimating that gulls are becoming more reliant on terrestrial garbage. The decline in fish availability may be causing a shift in diet composition. There is a greater reliance on terrestrial food sources, which may be of poorer quality. Future Trends and Research Needs There is good evidence of the need for continued monitoring of bird populations. We need to evaluate the effects of cormorants on fish populations and island plant communities. Outbreaks of Type E botulism have appeared in Lake Erie recently and we need to find answers to the questions, "What are the implications for changes in herring gull diets?", and "Will there be increasing incidence of botulism outbreaks?" The herring gull diet reflects fish availability. The herring gull population may decline if the prey abundance remains low. Temporal trends inferred from contaminant monitoring data may be affected. |
| Back to Top |
LAKE ERIE NUTRIENT TREND RESULTS 1983-2000
David Rockwell
US Environmental Protection Agency, Great Lakes National Program Office, Chicago, IL 60604
Abstract
|
From 1983 through 2000, the concentrations of nutrients in the open waters of the western, central, and eastern basins of Lake Erie were monitored by the U.S. EPA Great Lakes National Program Office. To illustrate changes in nutrient concentrations that occurred coincidentally with the Dreissena invasion of Lake Erie, the data were analyzed for the periods pre-Dreissena (1983 through 1988) and post-Dreissena (1990 through 2000). Pre-Dreissena, median total phosphorous concentrations decreased significantly in each basin in Lake Erie, but they were below the water quality guidelines in all three basins only in 1988 and 1990. Post-Dreissena, no significant trend was observed for total phosphorous concentration in the western and eastern basins, but a significant increase was observed in the central basin. Pre-Driessena silica concentrations were usually below 0.2mg/L in both the central and eastern basins, but silica concentrations exceeded 1mg/L in both basins post-Driessena. There were no discernable pre- and post-Driessena trends in total dissolved phosphorous and nitrite+nitrate in any of the Lake Erie basins. Concentrations of chlorophyll a increased significantly only in the western basin during the pre-Driessena period, but post-Driessena concentrations significantly decreased in all three basins. Calculated rates of dissolved oxygen depletion exhibited a downward trend during the pre-Driessena period, reaching their lowest rates in 1988 and 1989. There has been no further change post-Driessena, however. Calculations of annual external phosphorous loadings through 1995 demonstrate loadings were less than the 11,000 ton target, suggesting that external total phosphorous loads were in control. Dreissena are implicated in these various changes in nutrient trends, but proof has not been established, and an understanding of the processes involved will require further investigation The US EPA has been monitoring nutrients and water quality in year 2000. Data collection from central and eastern basin is the same for all years. Data for the western basin includes the addition of an extra station. In 1989, there was a significant decrease in total phosphorous concentrations in all 3 Lake Erie basins. Since 1990, only one basin has shown a significant increase. If we excluded the data from 2000, we would have a significant increase in phosphorous levels. We monitored dissolved silica in the central basin. Silica levels began to increase through the 1980s and have increased dramatically through the 1990s. In the central basin of Lake Erie, spring chlorophyll a levels showed a decline, perhaps due to decreased numbers of diatoms. The dissolved oxygen (DO) depletion rate has been decreasing from 3.9 mg/L/d in 1960 to 3.1 in 1999. However, in 1989 and 1990 we saw the lowest of depletion rates, and the decreasing trend may have stopped at that point. Rates may be rising through the 1990s. The people in this room make up 98% of the workers in Lake Erie. Seventy percent of the data have been assembled since 1970. One problem is that we don't have textbooks to study the Great Lakes. Waves have an enormous effect in Lake Erie providing huge inputs of abiotic material relative to what happens in small lakes. In sediment traps, we find an order of magnitude more material in offshore areas once stratification breaks down. General Discussion Ralph Smith: How does tripton differ between big lakes and small lakes? There might be large differences between large and small lakes. We need to do a cruise on Lake Superior, too. Mike Twiss: I agree that we don't have textbooks for teaching Great Lakes Research. We heard this morning about the increasing concentration of macronutrients. This is similar to oceanography where there are high levels of nutrients but low levels of phytoplankton. Which trace metals should not be considered as toxins? Dave Culver: Some people have been testing whether the limitation of iron could be blocking transfer to algal growth. Jeff Reutter: I have a question for Trefor Reynoldson and Steve Nepszy. Trefor didn't think Diporeia was very important in the eastern basin and Steve indicated that it was number one food item in Lake whitefish. Can you explain? Trefor: My data is based on one site in the eastern basin. Diporeia isn't important there and has never been. I don't know if that's a representative site. Steve: Historically Diporeia were the preferred food item of Lake whitefish. John Gannon: We’re doing an interlake comparison. The disappearance of Diporeia in Lakes Michigan and Ontario is a real problem. Trefor Reynoldson: That is why I've done long term monitoring, and repeated sampling. So much data is based on single samples every year. I am not convinced that all the changes are real and not just spikes or valleys. We have no idea if this is related to Dreissena. Tom Nalepa based his conclusion regarding declining Diporeia numbers in Lake Michigan on much greater numbers being observed in the 1930s. Trefor Reynoldson: I am not convinced that Dreissena has caused the loss of Diporeia in the eastern basin. Mike Stainton: I wanted to make a few comments on things we heard this morning. Fifty percent of the people working on Lake Winnipeg are also in this room. We are interested in using Lake Winnipeg as an unperturbed reference site. In Lake Winnipeg, there is an interaction between allochthonous and autochthonous food. Light is limited by sediment inputs from the Red River. When large floods occur, most of productivity is from terrestrial carbon. There is a high degree of variance annually, spatially, and interannually. It is a treat to be in a room talking about large lakes. It’s nice to be connected. |
| Back to Top |
BIOLOGICAL ENGINEERING FOR REMEDIATION
S. Siripornadulsil1, P. Rubinelli2, J. Ewalt3, D.P. Verma4, and RICHARD T. SAYRE1,2,3
Ohio State University, 2021 Coffey Road, Columbus, OH, 43210 1Biophysics Program, 2Department of Plant Biology, 3Ohio State Biochemistry Program, and 4Department of Molecular Genetics
Abstract
|
The unicellular green alga, Chlamydomonas reinhardtii, binds many heavy metals in a species-specific and pH-dependent manner. Significantly, Chlamydomonas is readily amenable to genetic manipulation to enhance its capacity to sequester and tolerate heavy metals. We have explored a variety of strategies to enhance the heavy metal binding properties of Chlamydomonas including, 1) the expression of the heavy metal binding protein, metallothionein-II, in the cytoplasm and on the cell surface as gene fusion products, and 2) the expression of plant stress tolerance genes that regulate proline and cysteine synthesis. We also are exploring combinatorial approaches to identify heavy metal binding peptides to be expressed on the surface of recombinant algae. Finally, we have identified unique algal proteins that are selectively expressed following heavy metal exposure. Studies are underway to determine whether constitutive expression of these proteins enhance the heavy metal binding properties of the cells. Overall, we have shown that algae expressing some of the aforementioned gene constructs have an enhanced tolerance to toxic concentrations of heavy metals (cadmium), an increased capacity (three-fold) to bind heavy metals, or both. Each of these strategies and outcomes will be described. Heavy metals have density greater than 5 g/cm3. They are found in low abundance in the earth’s crust. Many are toxic at low concentrations. Unlike organic pollutants, heavy metals can't be decomposed. Therefore, they need to be sequestered. Molecular Mechanism of toxicity: Heavy metals replace essential metals in metalloenzymes. They bind to sulfahydryl groups, facilitate formation of reactive oxygen species alter redox status of the cell, especially glutathione levels. Heavy metals also interfere with essential metal uptake and transport. The US EPA has established maximum contaminant levels for drinking water. The levels of many of these toxins are set at the same concentrations as organochlorines. We are especially interested in cadmium (Cd). The limit is set at 5 ppm. Sources of Cd include mining and smelting, coal combustion, acid rain, industrial sources (plating and electronics), sewage and waste disposal, gasoline (lead), and natural weathering. We also looked at heavy metal loadings for the Clinton, Detroit, Raisin, Maumee and Cuyahoga Rivers AOCs. The 1996 mercury input into Lake Erie was 1.03 metric tons. EPA standards for mercury in lake water is 1.8 ppb. Therefore, the levels in Detroit waters are 65 times the EPA standards. Annual cadmium input was 2.2 metric tons. Most sources are US-based, especially from Ohio. Current recovery strategies include chemical precipitation, which is non-selective and results in large volumes of contaminated water (especially rich in Fe), and ion exchange resins which are more selective and be can be regenerated, but are very expensive. There are advantages to using algae as heavy metal sponges (phytoremediation). This work is based on using plants, which selectively pick up heavy metals. We can then harvest it and reduce it to ash. This can result in complete remediation of an area over time. In 2005, the terrestrial phyto-remediation industry will be valued at $5B and will grow by 20-30% each year for a long time. What about the use of plants in water? Plants are not always feasible. We have used algae because they are easily grown and harvested, have a high surface:volume ratio and are tolerant of high heavy metal concentrations. They have a high heavy metal binding capacity 4-9% of fresh weight (=1:1 dry weight). Algae can synthesize heavy metal-binding proteins and have a high affinity for binding proteins, which can be genetically engineered. Chlaydomonas is the first algae to have the genome worked out. It is like a yeast. Characteristics of trace metal binding properties of chemical binding sites: Live cells bind one-half of the mass of cadmium as do dead cells. Cells bind at 0.8-1 g Cd/g dry weight. The binding of Cd to dead cells is pH dependent. Elements such as Ca, Na, and K have little effect on Cd binding. Enzyme groups are pH dependent. There is a 3:1 molar ratio of Cd and Ca. Most Cd is bound at pH 7 and is released at pH 3, so material can be recycled. Essentially this is a biological ion exchange material. We have also looked at engineering to increase binding capacity. We can bind chicken metallothionein proteins into Chlamydomonas and intercept the metal before it gets into the cell. Presently, we have just done the growth analysis, which shows that the growth of constructs is much faster than the wild controls. We expect the binding capacity of constructs to be greater, too. Tryptin is used to find peptides. It is greater than 7 amino acids long and will bind metals using a phage. Once the peptides are displaced on the surface protein of a bacteriophage, the gene sequence is trapped and we can identify them. We are focusing first on peptides that bind Ni. We have found several peptides that are very selective. They have a proline towards the N terminus. We have seen this in several cases where a pocket is formed that would hold metals fairly tightly. We are now taking small genes, expressing them as monomers or as polymers, and then expressing them on the outer surface of cells. Potential Uses: Potential uses include using dried algal mats as heavy metal absorbents and filters. Live algal boreactors could be used for treatment of heavy metal effluents and the selective enhancement of sedimentation of heavy metals from contained water columns. The -biomonitoring of heavy metal bioavailability (fluorescent heavy metal sensitive proteins) [e.g., NEAT] and gene discovery for new heavy metal binding of tolerance factors such as heavy metal chaperonins. Collaborators: Samual Trainer OSU, Lada Malek Lakehead University, and Desh Pal Verma, OSU Questions: Based on the expertise and interests of a group, can you comment on the work done with animal feeds and aquaculture? We have a number of other projects with Chlamydomonas. One area is trace metal delivery. We can express antigens on the surface of algae and can use this as vaccines for fishes. There is a new way to express antibodies on the surface of algae to remove viruses from water (fish viruses). We are also expressing fish hormones on algae, and then we feed the algae to fish, thus avoiding the impetus for transgenic fish development. How does your research translate into remediation? There are 2 technologies the injection/recovery approach and sonication. In the injection/recovery well approach, weak acetic acid is injected into the sediment, brought to the surface, and treated in situ. Chlamydomonas will grow on weak acetic acid, which provides a carbon source. Linda Weavers is using sonication in situ on sediments to release metals. However, there is the issue of what to do about the metals you lose to the water column? It’s possible that you could add algae and harvest them. When using transgenic species, if they are released, what is the potential effect of gene jumping and wild stocks? We are trying to avoid using live material as much as possible. We have a number of strategies that can be used that would preclude gene jumping. Chlamydomonas need flagella for mating. The mutant lacks a flagellum and has never been shown to mate. Also, we could put a gene into the chloroplast of DNA of positive gender. We also have mutants that can't survive in nature. |
| Back to Top |
Research Need #2. Habitat Issues
RECENT DEVELOPMENTS IN CONSTRUCTING CLIMATE CHANGE SCENARIOS FOR IMPACT AND ADAPTATION ASSESSMENTS
Linda Mortsch
Environment Canada, University of Waterloo, Waterloo, ON N2L 3G1
Abstract
|
Despite Canada’s signing the Kyoto Protocol on Climate Change in 1998 Greenhouse gas emissions have continued to rise. Canada has committed to a reduction target of 6% below 1990 levels by the period 2008 to 2012. In order to achieve this goal we require a 50% global reduction of greenhouse gases. Despite efforts, Canada’s emissions of greenhouse gases have continued to rise. Impacts to Lake Erie include more frequent and more intense storm events as well as more intermittent and more intense rainstorms. This may lead to greater evaporation and in turn may cause lower water levels. The following items are statements concerning human influence on climate change from the Intergovernmental Panel on Climate Change. * The balance of evidence suggests that there is a discernible human influence on global climate (1995). There is new and stronger evidence that most of the warming observed over the latest 50 years is attributed to human activities (2001). * The Kyoto Agreement called for emission reductions but greenhouse gas concentrations are still increasing! * The Kyoto Agreement set a global target of 5.2% reductions by 2008 - 12 for developed countries only. There are rising emissions and no targets set for developing countries. For stabilization to be achieved below 550 ppm CO2 (doubling), we need more than a 50% reduction globally in greenhouse gases. * We are committed to a changing atmosphere and we need research demonstrating 'dangerous interference with the climate system'. * When we look at the trends we're seeing in Lake Erie, we need to ask if they are related to changing temperature or precipitation. We're committed to change, but as scientists, we must provide information on what is a dangerous interference with the climate. * The blue line is 2 times the CO2 level. The yellow line is the Kyoto target to 2100. The red line is the best estimate of likely levels (highest). Most estimations of effects are based on IS97A (yellow line). Other lines in the figures are lower, based on estimates of variable strategies. The idea of achieving an equilibrium at twice the historical the CO2 level is now obsolete because there is an instant increase of the atmospheric O2 concentration (2xCO2,4xC02) More recent modelling attempts have been preliminary efforts to determine the effect of the transient runs i.e. greenhouse gases only, versus greenhouse gases plus aerosols. It is also important to note that although all general models have used the IS97a line, models differ in their components. Precipitation versus temperature change is the average from over all of Canada. The Australian model predicts larger temperature increases. We need to try and recognize different outputs of the different models. As we forecast further ahead in time, there is a wider spread in estimating among models. The Intergovernmental Panel on Climate Change have made recommendations for scenario development. Users of the climate forecasting models should design and apply multiple scenarios in impact assessments where these scenario span a range of possible future climates, rather than designing and applying a single 'best guess' scenario. This "sensitivity analysis" reflects the uncertainty in the models. Summary information is available at http://www.ipcc.ch/ Future Trends and Research Needs In Lake Erie, we are experiencing higher temperatures and higher precipitation, but the timing of the precipitation is more concentrated, i.e. less snow. We are also seeing more intermittent, more intense rainstorms. From this, we expect that in the future evaporation will likely exceed precipitation so we may get lower water levels. We are seeing a number of extremes. For instance, the daily minimum is increasing much more than the daily maximum. We predict that the number of rain days will decrease, but amount of rainfall will increase. The number of extreme wind events will also increase. All of these features may have significant effects on shoreline processes – erosion, runoff patterns, turbidity, water and nutrient mixing, etc. Those changes have to be factored into our plans for forecasting the status of the lakes as well as the land surrounding it. |
| Back to Top |
CONTINUING LOW LAKE ERIE WATER LEVELS
Frank H. Quinn
Great Lakes Environmental Research Laboratory, 2205 Commonwealth Blvd., Ann Arbor, MI 48105
Abstract
|
During the period 1970-1998 we experienced extremely high lake levels, the highest levels regime in our 150+ years of record. This regime continued through most of the 1990s, with a near record elevation in the summer of 1997. However during the last half of 1998 and all of 1999 the levels dropped dramatically to levels last seen in the mid 1960s. The one- and two-year drop between July 1998 and July 1999, and between July 1997 and July 1999 were the second largest drops in 140 years. During 1999, Lake Erie had the smallest seasonal rise since 1967, and drought conditions are prevalent in much of the eastern U.S. The first year of the millennium saw a continuation of the low water levels. The outlook for 2001 is for lake levels peaking 20 cm below last year’s values. The primary impacts of the decreased water levels are being felt by the commercial navigation industry, recreational boaters, and individuals using the beaches. The lower lake levels have resulted in reduced capacity for the Great Lakes carriers and greatly reduced depths in the slips of marinas serving recreational boating. On the positive side, the wetland areas have dewatered for the first time in 35 years, rejuvenating plant diversity. In addition, the beaches are the widest experienced in the past 30 years and the lower levels will likely result in a temporary decrease in shoreline erosion. Hydrologic Conditions Now and in the Future The effects on the Upper Great Lakes also affect Lake Erie. There are a number of water resource impacts - water quality, anoxia, dredging, increase in parasites of fish. Thus, water levels are very important. Water levels are a function of the upper lake’s hydrologic cycle. The snow melt provides a lot of water supplies – in fall we see negative water supplies due to an increase in evaporation. There are anomalies in precipitation - negative precipitation. In 2000, there was a lot of precipitation in the spring. In the past three years, there has been greater than normal evaporation. Lake Superior water flows into Lake Erie. Lake Superior water levels have been below normal for the past 3 years. In 1998, we experienced the warmest year on record. Water levels were the lowest since 1925. We have historic Lake Erie records extending back to 1860. The majority of the data is from 1970 to present, a period of high lake levels. In 1964, we had very low lake levels, and this is not part of our experience for dealing with Lake Erie. Seasonal range had shown continual decrease over the past 59 years. From 1970 to 1998 these very high water levels went down to a minimum and then back up followed by a steady decrease. This year’s spring levels in Lake Erie are slightly below the average. Lake levels aren't that bad from a long term perspective. Lakes Michigan and Huron are almost at levels of all time record lows. Lake Erie water levels will probably peak 20-22.5 cm (8-9 inches) lower than last year. The Canadian model for climate change predicts that Lake Erie levels will be 75 cm (30 inches) lower in 2030. The Hadley Centre climate model (Gordon et al. 2000; Pope et al. 2000) predicts the opposite scenario from the Canadian model. Tributary flows will differ but the net effect is higher water levels. Future Trends and Research Needs Future scenarios are based on models. The future is hard to predict, but a continuation of present trends will alter use of wetlands and other Great Lakes uses. References Gordon, C., C. Cooper, C.A. Senior, H. Banks, J.M. Gregory, T.C. Johns, J.F.B. Mitchell, R.A. Wood. 2000. Hadley Centre for Climate Prediction and Research, Bracknell, UK Climate Dynamics 16:147-168. Pope, V.D., M.L. Gallani, P.R. Rowntree and R.A. Stratton. 2000. Hadley Centre for Climate Prediction and Research, Meteorological Office, London Rd., Bracknell, Berks, UK. |
| Back to Top |
IDENTIFICATION AND MAPPING OF LAKE ERIE STRUCTURAL HABITAT
Scudder Mackey
Great Lakes Protection Fund, 1560 Sherman Rd. Suite 880, Evanston IL 60201
Abstract
|
Structural habitat is created by the dynamic interaction of geological, hydrological, and biological processes. Habitat impacts are cumulative, and slow acting, and show effects on a scale that is not easily detected by the casual observer. Severe degradation of habitats in Lake Erie is ongoing due to alteration of watershed, hydrology, etc. We are only now starting to see the effects of this degradation. Three components of aquatic habitat are energy, geology (substrate), and water mass flow. These three form a confluence into a 'sweet spot' for an organism to use for habitat. Substrate can be classified according to hardness, stability, porosity, permeability, and roughness. All components are important for how organisms use the materials. Aerial photography is used for mapping substrates on land using GIS. The data doesn't exist for the Great Lakes. Side scan sonar is also used along navigable rivers and lakes. It is geographically referenced, and the data can be input into GIS to produce a substrate map. We can use this for identification and mapping of Lake Erie structural habitat. An example is Painesville-on-the-Lake. The amount of sand in Ohio and Pennsylvania used to be greater but much has been lost due to hardening of shoreline. Mapping allows for quantification and determination of connectivity of soft substrates, linking biota to the soft substrates and focusing efforts on complex or critical areas. This cannot be accomplished by geologists or biologists working alone. Thus, we need to work together. Future Trends and Research needs We need more complete temporal and geological data sets (side scan sonar and GIS). We must assess the impact of geological and hydrological modifications and cumulative impacts rather than gathering only site specific information. There are a number of challenges. It is easy to use geologic/hydrologic models for identification and mapping of habitat. From this we can determine linkages between habitat and geology and devise methods to assess cumulative impacts of geologic and hydrologic modifications on this ecosystem. |
TOWARDS A COMPREHENSIVE ASSESSMENT OF WETLAND QUALITY OF LAKE ERIE COASTAL MARSHES: COMBINING LANDSCAPE AND FOOD-WEB APPROACHES
PATRICIA CHOW-FRASER, V. Lougheed, S. McNair, and B. Crosbie
McMaster University, Biology Department, 1280 Main St. West, Hamilton, ON L8S 4K1 chowfras@mcmaster.ca
Abstract
|
Protecting habitats at risk is one of the most challenging tasks for environmental resource managers today. Coastal marshes of the Laurentian Great Lakes is an example of a threatened and endangered space that requires our immediate attention. Most of the wetlands that occurred on the shoreline of the lower Great Lakes prior to European settlement have been irreversibly destroyed for urban and agricultural uses, and those that remain are severely degraded. Because of their great value as habitat for economically and recreationally important fish and wildlife, and because they have exceptionally high biodiversity, governments in both Canada and the United States have implemented programs to prevent further losses, and to increase wetland area through restoration projects. Recent collaborative funding is making possible the development of a binational georeferenced digital wetland inventory that can be widely accessed and updated by managers and researchers from both countries. This can only be considered the first of several critical steps towards establishment of a basin-wide conservation strategy. Another equally important step, especially where the lower lakes are concerned, is development of standardized wetland assessment tools (e.g., Index of Biotic Integrity, IBI) that can be used on a basin-wide scale to evaluate wetland quality, since degree of marsh degradation can greatly affect habitat functionality. In this talk, we will use water-quality, land-use, zooplankton and periphyton data collected from 65 coastal marshes of the Canadian Great Lakes to show how water quality data can be used to ordinate wetlands along a degradation gradient. We will show how the relative position of wetlands along a synthetic environmental axis (Principal Component Axis which is driven primarily by the concentrations of phosphorous, nitrogen, and suspended solids) is indicative of the type of agricultural, forested and/or urban land uses in the wetland watershed. We will use empirical data to build a conceptual ecological model of a healthy marsh foodweb to support development of two alternatives to the IBI, one based on presence/absence of plant-associated zooplankton (Wetland Zooplankton Index, WZI) and the other based on biomass of periphytic algae. Finally, we will show how the WZI has been used to quantify the response of the zooplankton community to carp exclusion in Cootes Paradise Marsh. Frankly, we don't have enough data right now to assess the quality of wetlands in Lake Erie. We currently use landscape and food web approaches but we also need to consider watershed effects, examine the history of coastal marshes, and realize their importance for fish habitat. Great Lakes wetlands have been lost due to dredging, draining, introductions, etc. and as a result we have experienced up to a 70% loss thus far. WIRE net (http://www.on.ec.gc.ca/glimr/wirenet/) has bi-national information on wetlands of the Great Lakes. Bedrock, climatic factors, and land uses affect development, quality, and quantity of wetlands. We use eco-region delineations, which are distinctive stretches of Great Lakes shorelines that support significant amounts of wetlands. In 1998, we examined 40 wetlands. Lake Erie is second to Lake Michigan in quantity of wetland habitats. They are important for fish habitat so we must include wetlands for fish habitat assessments. From 1996-98 we sampled 62 marshes. We collected geomorphic information and water quality data including total phosphorous and total dissolved solids (TDS), wetlands distribution, and categorized the wetlands by degree of degradation. In southwestern Ontario, there are predominantly 4 landuse categories - urban, agricultural, forested, and agri-forested. There is a quality gradient from north to south in agricultural land-use wetlands. The clear, low-nutrient wetlands had lots of submergent species. High water and nutrients gave rise to high epiphytes, which compete with submergents and win out. Epiphytic growth is related to wetland quality. Periphyton is potentially a good indicator of water quality. Macrophytes provide habitat for fish. Zooplankton can be used for determining habitat quality. Larger animals are associated with submergent vegetation and certain plant types. Some species are more tolerant of conditions. Wetland tolerance is complex. A Wetland Zooplankton Index (WZI) was used for monitoring wetland quality. WZI integrates plant, water quality, and fish information, and is more sensitive than the fish Index of Biotic Integrity (IBI) for detecting changes and comparing among wetlands. The WZI was used on Cootes Paradise over the short term. We determined that carp disturbance was important and built a fish way to lower carp biomass. The carp biomass is now 90% lower and there has been improvement in water quality. However, this is not necessarily related to carp exclusion. Other fish taxa have also increased. |
FISH HABITAT, RIVERINE INFLOWS AND WESTERN LAKE ERIE: IMPLICATIONS FOR FISHERIES MANAGEMENT
JEFF TYSON1, Dave Davies1, Scudder Mackey2
1Ohio Department of Natural Resources - Division of Wildlife, 305 E. Shoreline Dr., Sandusky, OH 44870 2ODNR-Division of Geological Survey
Keywords: physical habitat, western Lake Erie, fish distribution, river inflows
Abstract
|
Fisheries related habitat issues in the Great Lakes, specifically Lake Erie, are very complex. Due to this complexity, few broad-scale initiatives have been undertaken to affect habitat restoration in the Lake Erie basin. Most habitat "restoration’’ projects in the Lake Erie basin have been site specific in nature, including the addition of offshore reefs, enhanced wetlands, and other areas for species-specificity based upon HSI curves. Therefore, although these projects have had largely local, positive impacts, there is some question as to how these fit in to the larger picture, and what cumulative impacts they have on the basin as a whole. Part of the problem appears to be the lack of a broad systematic framework into which the numerous site specific habitat projects, undertaken by a broad spectrum of government authorities, as well as individual citizens, would fit. This is one reason why fisheries managers have been slow to promote long-term, broad-scale habitat initiatives. The two primary factors that Lake Erie managers feel that they can directly control from a fisheries standpoint are exploitation and stocking. Habitat initiatives, although viewed as important, perceptually have no immediate returns for the economically-important offshore fisheries. The relatively shallow western basin of Lake Erie, being influenced largely by riverine, as well as large-lake processes is unique to the Great Lakes. While approximately 90% of the volume of Lake Erie inflow is derived through the Detroit River, systematic productivity is derived primarily from the large watersheds along the south shore due to their young, productive, Pleistocene glacial soils, and the high percentage of land-use in agriculture. Due to this physical setting, the western basin has long been purported to be the most productive water in the Great Lakes, supporting a high biomass of forage fishes, three extant spawning stocks of walleye, and remnant populations of lake sturgeon, as well as other native species of interest. Perceiving habitat in the western basin at a broader scale, by identifying broad, spatially, repeatable patterns in physical characteristics of the basin, should allow us to simplify the habitat complexity. We also attempted to determine if fish and zooplankton were responding to these repeatable patterns in the physical setting with repeatable patterns of aggregation. From these results we will propose an overarching framework for additional habitat restoration work and target techniques such that we can potentially have a long-term impact upon the sustainability of the fish community in western Lake Erie. We used interagency bottom trawling data, collected since 1988, to examine whether there were repeatable spatial patterns in the physical characteristics of the western basin of Lake Erie. We also used this data to examine the spatial distribution of fishes within the basin to determine if there were repeatable patterns in distribution. The spatial integrity of these samples was maintained and the data were combined across agency and year to spatially quantify if there were repeatable aggregations inter-annually. In 1996 we also collected zooplankton samples at each station in Ohio waters, and abundance of crustacean zooplankton was also examined relative to patterns in physical data and fish distribution data. Using a hierarchical agglomerative clustering procedure, with temperature and secchi transparency information collected during the annual basin-wide bottom trawling surveys, we found that the major inflows into the western basin do remain relatively discrete and could be characterized as habitat polygons. Several of the species of fish examined also exhibited repeatable spatial patterns in distribution and abundance across the 12 year time series and tended to aggregate within certain habitat polygons. The zooplankton data showed similar spatial trends in density as well. Relatively high zooplankton densities were associated with the large south shore inflows, and lower abundance was associated with the Detroit River. The higher primary and secondary production associated with the inflows of these south shore tributaries is most likely a function of the high systematic productivity of these watersheds and indicates the importance of these rivers as structuring forces in the western end of Lake Erie. From our preliminary results it appears that the physical characteristics of inflows remain discrete through time and the influences of large tributaries (Detroit, Maumee, Sandusky) are significant structuring forces in the western basin. The natural ecological boundary of these tributaries and watersheds extends well beyond the confluence of the rivers and Lake Erie. Western basin waters are strongly influenced by these tributary water mass temperatures, dissolved and suspended substances, and hydraulics. By examining both spatially and temporally explicit repeated patterns in distribution and abundance of fishes we can begin to effectively define physical habitats for these species without the significant subjectivity of Habitat Suitability Curves. By breaking down the complexity of the basin and providing physical linkages between watersheds and the physical habitats supporting Lake Erie fish communities, we should be able to effectively develop and implement a habitat enhancement/restoration scheme that will affect tributary, nearshore and offshore fish community abundance and sustainability. Additionally it provides an opportunity to create an overarching systematic framework for habitat restoration at watershed/lake basin scales. This information would also give Lake Erie fisheries managers impetus to move up into the watersheds to affect water quantity (i.e. flow regime) and water quality characteristics for the benefit of Lake Erie fisheries. Rehabilitation/protection of important structuring forces on habitats that are predictable in space and time is truly meaningful to the long-term sustainability of fish communities. The specter of repeated aggregation of species in the western basin will not only provide for further habitat research, but will also influence assessment protocols, as well as exploitation strategies and adds to knowledge of the biology of the resources we steward. Habitat in large lake ecosystems is complex. Few large-scale habitat initiatives have occurred. Most of the research done is site specific. The western basin fish habitat is important for walleye. Physical characteristics of basin Between 80-90% of the inflow to Lake Erie is from the Detroit River. Productivity is from large watersheds in the western end of Lake Erie (Maumee and Raison Rivers). The young glacial soils of the watershed and size are factors in the productivity. Tributary water mass characteristics are the dominant factors that create habitat. These are relatively distinct characteristics that are repeatable in space and time. Our sampling effort involves trawling at 60-90 sites annually during August. The data collected includes coarse water information i.e. Secchi depth, dissolved oxygen, temperature, and fish collection. The western basin is more transparent at the north shore and is cooler. There are ecological boundaries of watersheds reflected in the basin as they don't mix instantaneously. These are discrete boundaries based on the coarse data collected (using clustering of data). The Detroit River habitat is a polygon of cool, clearer water. The Maumee River is silty and warmer. The data polygons from April 2000 are similar. Biological characteristics include repeatable patterns in fish. Age 0-YOY walleye 1988-1999 are dominant in the Maumee polygon. Adult yellow perch are associated with Detroit River discharge. The crustacean zooplankton density is low in the Detroit River polygon. Higher values are found in the Maumee, Sandusky, and Ohio Rivers discharge areas. Influence is relatively discrete. They appear predictable and repeatable in time. Future Trends and Research Needs We could develop a systematic framework on spatial and temporal data for physical attributes. From this you can provide a larger picture for fine scale work and management aspects. |
| Back to Top |
INVERTEBRATE INVASIONS IN LAKE ERIE: RECENT DEVELOPMENTS AND PROGNOSTICATIONS
Igor A.Grigorovich1, HUGH J. MACISAAC1, Vladislav I. Monchenko2
1Great Lakes Institute for Environmental Research, University of Windsor, Windsor, ON, Canada 2Schmalhausen Institute of Zoology, National Academy of Sciences of Ukraine, Kiev, Ukraine
Abstract
|
The western Lake Erie--Lake St. Clair corridor of the Laurentian Great Lakes may be characterized as an invasion 'hotspot'. This region currently supports many recent invaders to the Great Lakes including the zebra mussel Dreissena polymorpha, quagga mussel D. bugensis, round goby Neogobius melanostomus, tubenose goby Proterorhinus marmoratus, waterflea Bythotrephes longimanus (=cederstroemi), and amphipod Echinogammarus ischnus. Of this group, the former and latter species are now among the most dominant benthic invertebrates in Lake Erie, and the quagga mussel continues to expand its distribution and relative abundance. The waterflea Daphnia lumholtzi, a warm water species native to northern Africa, southern Asia and Australia, was discovered in western Lake Erie in 1999, although surveys in 1998 and 1997 failed to detect its presence. To assay for other unrecognized invaders, we surveyed shallow water habitats in the lower Detroit River and western Lake Erie during October 1997 and May 1999. Two harpacticoid copepod species native to the Ponto-Caspian region of Eurasia ? Nitocra incerta and Schizopera borutzkyi ? were identified for the first time from North America. Both species were collected on/in bottom sediments from the mouth of the Detroit River in May 1999. Populations of N. incerta and S. borutzkyi included ovigerous females, indicating that both species were reproducing and likely established. As with another non-indigenous copepod, Nitocra hibernica, these recent invaders were likely introduced through shipping activities into the Great Lakes, as they can tolerate ballast water transport in dormant stages. Lake Erie's highly differentiated morphometry, rich habitat diversity, abundance of established nonindigenous species, large human population in its watershed, and dominance with respect to first-port-of-call visits by international NOBOB ships, indicate the lake is highly vulnerable to additional species introductions. Invasions by thermophilic stenotherms like D. lumholtzi may become more commonplace as regional climate warms, illustrating the interactive nature of multiple stressors on lake ecosystems in the Great Lakes basin. Lake Erie has been affected by physical, chemical, and biological factors over the past 100 years. Invasive species are expected to cause the most change in biota in the next century. For instance, Echinogammarus has greatly expanded its range in the last 5 years. Most invaders are from the Ponto-Caspian region. There are a number of invasion corridors. Using some genetic evidence we determined that a number of invasive species originate in northern Europe and are brought to North America through ship ballast water. There are two classifications for freighters ballast on board (BOB) or no ballast on board (NOBOB). BOB ships contain salinated ballast water which is loaded in Europe and discharged en route through the Great Lakes. NOBOB ships have no ballast but do contain up to 50% residual sediment in the ballast tanks. These ships add or release ballast water at ports throughout the Great Lakes, which allows for spread of animals throughout the Great Lakes. Mixing lake water with sediment can mix animals together or allow for release of resting stages into the Great Lakes. For example, Echinogammarus is largely replacing Gammarus in Lake Erie. Daphnia lummholtzi, a cladoceran species native to Africa and the Indian sub-continent has rapidly spread through the southeastern United States. This species however is a thermophile and probably won't do well in the rest of the Great Lakes. Lake Erie is expected to increase in temperature resulting in expanded ranges. The Pea clam - P. punctataum (P. moitessierianum) has been in Lake Erie for the past 100 years but is probably not native. It is a very small clam and is established as far north as Lake St. Clair. Harpacticoid copepods have been introduced e.g., Nitocra incerta and Schizopera borutzkyi. One protozoan has been introduced, the Acineta nitocrae, which is parasitic on copepods. Sixty-four percent of the copepods examined contained at least 3 of these parasites. We do not know when they were introduced. Future Trends and Research Needs Currently, ballast water and associated sediment are the greatest threat of introduction. Resting stages are important factors in the introduction and interlake movement of invasive species. Other sources include hull fouling, aquarium trade, coincidental release included in intentional fish stocking programs, and southern river vectors becoming increasingly important as the basin warms regionally. |
| Back to Top |
NONINDIGINEOUS FISHES IN LAKE ERIE
T.B. Johnson,1 L.D. CORKUM,2A. Dextrase3, M. Dochoda4 and E. Reeves5
1Ontario Ministry of Natural Resources, Lake Erie Fisheries Station, Wheatley, ON N0P 2P0 2Department of Biological Sciences, University of Windsor, Windsor, ON N9B 3P4 3Ontario Ministry of Natural Resources, Lands and Natural Heritage Branch, Peterborough, ON K9J 8M5 4Great Lakes Fishery Commission, Ann Arbor, MI 48105 5Ottawa, ON K1Y 2E8
Abstract
|
Lake Erie has a long history of colonisation by exotic organisms. Of the 143 fish species in the Lake Erie basin, 34 of these are nonindigenous species (NIS). Nineteen of these fishes have become established, while 15 others have been reported but failed to establish populations. NIS fishes now account for over 75% of the commercial harvest of fishes from Lake Erie. These fishes arrived through a variety of vectors including intentional release (stocking), unintentional release (aquaria, ornamental ponds, bait buckets, and aquaculture), ballast water, and canals. We describe the status of the dominant nonindigenous fishes, comment on their ecological impact, profile three candidate species likely to arrive in Lake Erie within the next few years, and review current policy designed to mitigate the introduction of nonindigenous fishes to Lake Erie. Rainbow smelt (Osmerus mordax), alewife (Alosa pseudoharengus), white perch (Morone americana), sea lamprey (Petromyzon marinus) and non-native salmonids (Oncorhynchus spp.) are the dominant nonindigenous fishes which have become established in Lake Erie. Rainbow smelt entered Lake Erie in 1935, twenty-three years after their escape from Crystal Lake, Michigan. The salmonids became established as the result of stocking programs initiated in the late 1800s. The other species invaded through ship canals in the first half of the twentieth century. Each species has had a marked impact on the fish community of Lake Erie. Predation on the eggs and young, and /or competition for food with native fishes characterise the impacts of rainbow smelt, alewife, white perch and non-native salmonids. The sea lamprey parasitises many native and non-native fishes, costing millions of dollars annually in lost production and control measures throughout the Great Lakes. However, rainbow smelt and alewife comprise the dominant prey of most piscivores in Lake Erie, and smelt, white perch and non-native salmonids generate millions of dollars annually to sport and commercial fisheries. Round gobies (Neogobius melanostomus) are a relatively recent invader (1993) that arrived via ballast water from the Black and Caspian seas. Gobies prey on the eggs and young of native fishes and aggressively displace native benthivores. Adults consume large quantities of zebra mussels, moving energy back from benthic to pelagic food webs. Unfortunately, this foraging pathway may also serve as a vector for contaminant transfer to important sport and commercial species. Eurasian ruffe (Gymnocephalus cernuus), blueback herring (Alosa aestivalis), and fourspine stickleback (Apeltes quadracus) are three fishes expected to invade Lake Erie within the next few years. All are now resident in the Great Lakes system: ruffe and fourspine stickleback arrived via ballast water, while blueback herring invaded Lake Ontario through the Erie barge canal. Current policy regulating nonindigenous fishes is inadequate to protect the Lake Erie ecosystem. Federal, provincial, and state policy lack a clear mandate, fail to provide standards for evaluating introductions, and have few provisions for interstate or bi-national coordination to establish consistent policies and legally effective rules. The province of Ontario and the four US states bordering Lake Erie each have some provision restricting the introduction of exotic fishes, although each is open to broad interpretation on the part of the enforcing agency. Ballast water legislation remains weak, as the main tool for regulation (open ocean exchange) remains voluntary in Canada, while the mandatory US program contains broad sweeping vessel safety exemptions that undermine the mandate of the policy. Unintentional introductions from aquaculture, bait fish, aquaria, and ponds are recognised within each jurisdiction as potential sources for nonindigenous fishes, but little policy exists to actually prevent the introduction of exotic fishes from any of the means. Ballast water is the primary vector for introduction of nonindigenous invertebrates, and has served as a source for a number of fishes. While considerable dialogue has been generated on ballast water controls, lack of action, loop holes and difficulties in enforcement have enabled organisms to continue to arrive via this means. Continued research is needed to identify potential invaders including an examination of donor and recipient habitats, assessment of vulnerability of recipient communities, evaluation of dispersal mechanisms, and description of international trade routes. Large-scale and long-term ecological studies and manipulation experiments are needed to accurately assess the impact of exotic species on the Great Lakes ecosystem. Until suitable policy and regulation is developed and enforced, Lake Erie and the rest of the Great Lakes ecosystem will remain vulnerable to invasion by exotic species. The negative impacts of these nonindigenous species far outweigh any potential benefit, and will continue to impair the long-term sustainability of the Great Lakes resources. Thirty-four of the 140 Lake Erie fish species are nonindigenous and established. Nonindigenous species (NIS) now contribute 75% of the commercial catch of fish in Lake Erie. NIS include rainbow smelt, alewife, white perch, sea lamprey, and a number of salmonids. Rainbow smelt (Osmerus mordax) were introduced in 1935 as a forage fish for lake trout (Salvelinus namaycush). Alewife (Alosa psuedoharengus) arrived in 1931 and were introduced via barges travelling through the shipping channels. They have been found to prey on young native fish, compete for food, and have been linked to EMS in salmonids. White perch (Morone americana) arrived in 1953. They are a brackish water species and are thought to have arrived in the Great Lakes via the Lake Erie barge canal. The white perch competes for food with native species such as the yellow perch. Sea Lamprey (Petromyzontidae marinus) arrived in 1921 and have had a significant impact on the fishery as they are parasitic on native fishes. In the mid 1980s, a number of tributary streams had lampricide applied which decreased the population. More recently the population is now increasing due partially to low level dams which were designed to exclude ammocoetes from migrating which are in ill repair. Non indigenous species of salmonids were stocked in the 1800s and in the 1960s. As a result, the native lake trout has been decreasing. The rainbow trout (Oncorhynchus mykiss), brown trout (Salmo trutta), and coho salmon (Oncorhynchus kisutch) are all established in the Great Lakes and are still stocked even though native trout rehabiltation programs are ongoing. The Round goby (Neogobius melanostomus) was introduced in 1993. It is an aggressive species out-competing the native mottled sculpin (Cottus bairdi) as well as a multiple spawner. All of these traits make it a particularly good invader. Gobies are now moving out into the sediment (?) and are expected to change contaminant patterns in Lake Erie. The Tube-nosed goby (Proterorhinus marmoratus), 3-spined stickleback (Gasterosteus aculeatus), and Chinese bighead carp (Hypophthalmichthys nobilis) are recent introductions. Three specimens of the Chinese bighead carp were found in Lake Erie. It is likely an escapee from ponds. Anticipated NIS fish include the Eurasian ruffe (Gymnocephalus cernuus). The Eurasian ruffe likely invaded in 1983 in Lake Superior. It is currently in Lake Huron and appearance is anticipated in Lake Erie. The Blue back herring (Alosa aestivalis) is native to the Atlantic and may enter through Erie Canal. The fourspine stickleback (Apeltes quadracus) is native to the Atlantic as well where it resides in the nearshore waters. It was likely introduced through ballast water. Other sources of introductions have been from the aquarium and water garden industry. There has been little control in these industries and although it is illegal to release fish into the Great Lakes we have had introductions of gold fish and sucker mouth catfish from these industries. Policy In the US, the Lacey Act prohibits transportation and introduction of NIS. In Canada, we have the Federal Fisheries Act, which prohibits introduction of NIS. The most recent protocols for NIS are available from the Council of Lake Committees page at http://www.glfc.org/lakecom.htm(.) This Council is drafting a set of national policies/codes on introductions and transfers of aquatic organisms. These include vector regulations from ballast and conservation statutes. However, there are no regulations for aquaculture, bait fish, aquaria, and pond release. There is also a fish rescue program and awareness initiative being undertaken by a coalition of agencies and organizations including the Ontario Ministry of Natural Resources, Canadian Association of Aquarium Clubs, Royal Ontario Museum, Toronto Zoo, Ontario Federation of Anglers and Hunters, and Fisheries and Oceans Canada. They have established the Invading Species Hotline at 1-800-563-7711. Future Trends and Research Needs We need: 1. a list of potential invaders 2. treatment of ballast 3. studies on the effects of NIS on natives fishes 4. long term studies on species interactions 5. large scale, long term manipulative experiments |
Research Need #4. Contaminant Processes in Lake Erie - Workshop Findings & Recommendations
SEDIMENT CONTAMINATION IN LAKE ERIE: A SPATIAL AND TEMPORAL OVERVIEW OF BANNED, CURRENT-USE AND EMERGING-ISSUE COMPOUNDS
CHRIS MARVIN1, Scott Painter1, Murray Charlton1, Fernando Rosa1 and Lina Thiessen1 and J.F. Estenik2
1Environment Canada, 867 Lakeshore Rd., Burlington, ON L7R 4A6
2Ohio Environmental Protection Agency, Division of Surface Water, PO Box 1049, Columbus, OH 43216
Abstract
| Environment Canada conducted Lake Erie sediment
surveys in 1995, 1997, and 1998 to characterize spatial and temporal trends in
contamination and for comparison with historical levels to assess the degree of
improvement in environmental quality since the advent of measures to reduce
sources. These surveys were also designed to assist in identification of
possible sources of contamination and areas where contaminant levels exceeded
Canadian sediment quality guidelines for the protection of aquatic biota.
Lake-wide concentrations of contaminants including metals, polychlorinated
biphenyls (PCBs), HCHs (Figure 1), hexachlorobenzene and DDT metabolites were
found to have significantly decreased from levels determined in samples
collected in 1971 in previous surveys. This trend was also evidenced by
contaminant profiles of core samples from the three major lake basins. There was
a lake-wide spatial trend in increasing sediment contamination from the eastern
basin to the western basin, and from the north-central basin to the
south-central basin.
Data from the 1997 and 1998 surveys also included current-use pesticides such as endosulphan, and contaminants requiring more specialized analytical methods and instrumentation, including polychlorinated dibenzo-p-dioxins and dibenzofurans and toxaphene. Sediment distributions and core profiles exhibited trends similar to those of other contaminants. Sediments in many areas of Lake Erie exceeded Canadian Federal and Provincial guidelines. However, exceedances of guidelines describing contaminated environments in 1997 and 1998 were largely restricted to the western basin and the southern portion of the central basin. Exceedances of Canadian Sediment Quality probable effects guidelines were most numerous for dioxins and furans followed by mercury. The Canadian threshold effects guideline for PCBs and the provincial lowest effect guideline were exceeded at 50% and 21% of the sites, respectively. Mercury, PCBs, and polychlorinated dibenzo-p-dioxins and dibenzofurans are responsible for fish consumption advisories in Lake Erie. |
Figure 1.
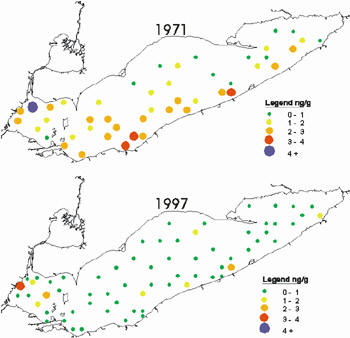
|
This talk will provide an overview of the contaminant classes in Lake Erie based on the Lake Erie Lakewide surveys. These surveys provide a spatial and temporal characterization of sediment contaminants in Lake Erie. Surficial sediments were sampled at 70 stations, cores were taken at 3 stations, and suspended sediment RAP index stations were taken at 3 stations monthly. Samples were analyzed for PCBs, organic carbon, mercury, dioxins/furans, toxaphene, PBDEs, PCNs, and chlorinated alkanes. Generally, there have been decreases in PCB concentrations in Lake Erie sediments over the past 30 years. The cores taken offshore of Presque Isle from 1971-1995, show a temporal decrease in PCBs in surficial lake sediments. There is a definitive spatial trend with increasing values from the northern portion of the lake to the southern. There are more PCBs in southern Lake Erie. There is a very significant decrease of PCB contamination in western Lake Erie. There has been a substantial decrease in the concentrations of PCB congeners, and for other contaminants in the lake such as Alpha-HCH (hexachlorohexocyclane). Mercury concentrations are greatest in the western basin of Lake Erie. There is a spatial trend of mercury concentration across Lake Erie with the greatest concentration occurring in the western basin and decreasing in the eastern basin. Dieldrin concentration is highest in the western basin where the TEL/PEL have been exceeded. IADN (Integrated Atmospheric Deposition Network) has mapped concentrations of dieldrin. This is a compound that needs to be further studied. Lindane is a chemical registered for use in Canada and is the 6th most highly used chemical for seed treatment. The guideline level is 1.38 ppb and is currently the chemical with the greatest percent exceedence of Canadian guidelines. Endosulfan concentration is highest in the western basin of Lake Erie. We also have other halogenated compound classes: dioxins/furans, coplanar PCBs, PCNs, BFRs, chlorinated alkenes (paraffins) and toxaphenes. For dioxins and furans we have huge exceedences of PEL guidelines in the western basin. Suspended sediment samples suggest active loadings of contaminants that may be historic or current. Toxaphene has a lake wide average of approximately 8 ppb. The guideline is 0.1 ppb for tissues. Every site sampled exceeded the guidelines. Tissue sample guidelines aren't very useful. The sediment quality index (SQI) is adapted from the water quality index. Forty parameters form each station. They are integrated and compared to guideline values. The score is poorer for every factor of increase that exists for each parameter. Summary Lake wide loadings have decreased for selected contaminants. PEL guidelines and exceedences are numerous for dioxins and mercury. The Detroit River is a vector for loadings into Lake Erie. Future Trends and Research Needs Environment Canada is committed to lakewide research and monitoring, the practical application of numerical sediment quality guidelines, and the weight of evidence approach. Question: David Rockwell: What are the suspected sources of contaminants? Response: A significant amount of material moving through the Detroit River is from the upper Great Lakes. For example, 95% of the current PCBs are coming from the upper Great Lakes. |
| Back to Top |
WATER-BORNE AND SEDIMENT-BORNE CONTAMINANTS IN THE LAKE ERIE-LAKE ST. CLAIR DRAINAGES, 1996-98
DONNA N. MYERS1, DANIEL T. BUTTON1 and Jeffrey W. Frey2
1U.S. Geological Survey, 6480 Doubletree Ave., Columbus, OH 43229
2U.S. Geological Survey, 5957 Lakeside Blvd., Indianapolis, IN 46278
Abstract
|
Water quality in the Lake Erie–Lake St. Clair drainages is greatly influenced by land use and human activities. A major pathway for contaminant transfer from the land surface to streams is storm runoff from urban and agricultural areas. As a result of herbicides in runoff, concentrations in streams were in the top 25 percent of streams nationwide and many public-water supplies must treat streamwater to reduce herbicide concentrations. As a result of nutrients in runoff, concentrations of total phosphorous and nitrate in some small streams and in major rivers were in the top 25 percent of streams nationwide. Concentrations of nitrate, although elevated relative to many other streams in the nation, were infrequently greater than the drinking-water standard of 10 milligrams per liter. Contamination of the bed sediments of small streams and major rivers by persistent and bioaccumulative contaminants was prevalent. The highest concentrations of PCBs (polychlorinated biphenyls) and mercury were found in streams draining highly populated urban and mixed land-use areas. Detections of contaminants in fish tissues indicate bioaccumulation; in fact, bioaccumulation of PCBs and DDT in some fish species presents a health risk to fish-eating wildlife. The pesticides detected most frequently were among those applied in the greatest quantities to agricultural and mixed-use lands. The herbicides atrazine, acetochlor, cyanazine, metolachlor, and simazine were detected in 50 to 100 percent of stream samples. Several heavily used herbicides and insecticides were detected in spring and summer at or above a standard for drinking water or a guideline for aquatic life. Elevated pesticide concentrations in streams persisted for 4 to 6 weeks after applications in agricultural and mixed-land-use areas. Annual average concentrations of total phosphorous were greater than the U.S. Environmental Protection Agency desired goal for the prevention of plant nuisances at 8 of 10 streams. Most affected were small streams and major rivers draining agricultural and mixed-use land. Major rivers flowing through agricultural and mixed-use land are major pathways of phosphorous to Lake Erie. Contaminants detected most often in the bed sediments of small streams and major rivers were arsenic, cadmium, copper, lead, mercury, zinc, PCBs, and PAHs (polycyclic aromatic hydrocarbons). The concentrations of mercury, PCBs, and PAHs were equal to or greater than sediment-quality guidelines, indicating probable adverse effects on aquatic life, in about 11 to 30 percent of samples, respectively. The most frequently detected contaminants in fish were highly persistent contaminants–DDT, chlordane, dieldrin, PCBs, and mercury. Except for mercury, use of these compounds in industry and agriculture in the United States was discontinued 15 to 25 years ago. The major Influences on surface-water quality and aquatic biota are storm runoff, land use and chemical releases, and bioaccumulative and persistent contaminants. Donna Myers This is a synthesis of 6 years of work from 1994 to 2000 from the National Water Quality Assessment Program. Water borne contaminants-in a broad range of aquifers - provide 60% of water resources to the US from ground water and surface water studies. Surface water- The land use in watersheds is largely agricultural, or multi-use. The major finding of land use is that agricultural and urban areas have large impacts on water quality. There is little wetland habitat left, forested area is reduced, and rainfall is higher than the average. Major findings: The kinds of pesticides that are used changes constantly. We now use more water-soluble pesticides, i.e. 8.3 million lbs. of herbicides and insecticides were applied in the drainages during 1994/95. The occurrences in water samples are from the chemicals most heavily applied on land. Inputs are from agricultural, urban, forested, and mixed land uses in decreasing order. Atrazine occurs at a higher rate in streams that drain row crop areas (corn, etc.). Diazinon concentrations are higher in urban-based areas. Chemical metabolites are detected all year long. Alachlor, metochlor, and acetochlor metabolites were usually found at higher concentrations than the parent compounds. This adds to the total amount found in streams. The concentrations are highest after application and decrease after 4-6 weeks. The amount of runoff and precipitation affects concentrations in streams. The effect is that most exceedences are found in row crops and mixed land use basins (3 microgram/L). The time-weighted concentration is higher for extended periods. The guideline for aquatic life is 1-8 ug/L. Half of the sites exceeded this guideline during May-July. It is unknown if this is having an adverse effect on the streams? Herbicide use in the Great Lakes basin is very high (>1.337 and is area of highest use). The Maumee River is the highest. Twenty-five percent of tributary streams have mixed land uses and the runoff is unintentional. Nutrients: The median concentration of total phosphorous exceeded the guideline in 80% of the sites. Point sources are treating waste to remove phosphorous, thus the majority of phosphorous input is from agricultural applications. We collected data at ten streams. We collected general information such as amount discharged/unit area normalized to per km2. Agricultural and mixed land use have the highest application rates of phosphorous but not the highest phosphorous yield (discharge from stream per km2). A summary report has been published on water quality (USGS circular 1203). Dan Button Fish tissue and sediment: We carried out a retrospective analysis of the sediment in order to characterize what is in the sediments and what characterizes the top 5 inches (2 cm) of sediment. We then related this to contamination in fish tissue. We used data collected from USGS sites and other sediment data we collected. A copy of the USGS protocols can be found on the web at http://water.usgs.gov/nawqa/protocols(.) Retrospective analysis- compared to TEL and PEL also LEL and SEL (for anthracin and total PAH) Samples of mercury in bed sediment had less than the TEL detected in many areas in the basin and in watershed sediments. There are elevated levels in the western basin tributaries. Total PAH in surficial sediments (recent deposits) from the Detroit River were less than 10 times the TEL, as the Ottawa River, Toledo. The Cuyahoga River is also high. We recorded PCB exceedences of up to 100 times the PEL. There are hot spots for PCBs in the Detroit River and the western basin of Lake Erie. The Detroit River and other tributaries are vectors of PCBs. Cadmium exceedences were recorded throughout the basin. The hotspot for Cd was the Detroit River. The Cu pattern is similar to Cd with widespread distribution. Pb exceedences were recorded in the Clinton River and the Detroit River. Zinc was recorded in the same area of other rivers. In summary, there was 100% detection of metals in samples. There has been a decrease in organochlorines over time. The probability of exceeding the PEL is almost a bell curve. Cumulative and persistent toxic contaminants in fish pose a threat to fish-eating wildlife and humans. The guidelines are established. Fish tissue for heavy metal elements is in the top 10% for content. Conclusions Most urban influenced streams have trace element levels in the top 10%. There is evidence that bioaccumulation of metals poses a threat to fish and fish-eating wildlife. PAHs are the most widely exceeded PEL of all contaminants. |
DISTRIBUTION AND BURDENS OF BIOACCUMULATIVE CONTAMINANTS IN THE LAKE ERIE FOOD WEB: A REVIEW
SARAH B. GEWURTZ
Department of Geography and Planning, University of Toronto, Toronto, ON M5S 3G3
Abstract
|
Contaminant behavior in the Lake Erie biota is complex and is influenced by several interrelated and dynamic processes. Key bioaccumulative chemicals have been identified and include polychlorinated biphenyls (PCBs), polycyclic aromatic hydrocarbons (PAHs), dioxin/furans, dieldrin, and other bioaccumulative agrochemicals/pesticides, mercury, and newer, ‘emerging-issue’ chemicals such as polybrominated diphenyl ethers, alkylphenols, and ethoxylates. Most studies have focused on organochlorines, especially PCBs, because of their toxicity and because high concentrations have been detected in top predators. There have also been several studies conducted on mercury and PAHs. More research in needed on the newer, ‘emerging-issue’ chemicals. The various classes of contaminants become concentrated in different components of the food web. Top predators usually contain much higher concentrations of the recalcitrant and more hydrophobic compounds, such as PCBs and DDE, than lower trophic levels since these contaminants are biomagnifed up the food chain. In contrast, chemicals that are susceptible to metabolic degradation, such as PAHs, are typically detected at relatively high concentrations in the lower trophic level organisms. The base of the benthic food web is much more contaminated than the base of the pelagic food web. Since top predators have recently become more dependent on the benthic food web due to decreased plankton abundance and production, benthic-pelagic coupling has been causing increased contaminant exposure to the higher trophic levels. Several contaminant biomonitoring programs have been initiated in Lake Erie. Organochlorine contaminant trends in herring gull eggs collected from 1974 to 1996 show that at present, most concentrations continue to decline. In contrast, fish organochlorine contaminant trends show concentration declines only in the 1970s and early 1980s. Since the 1980s, concentrations in fish have been stabilizing. The variability among the data sets may be due to several mechanisms such as changes to food web structure. Therefore, biomonitoring data may not be representative of changes to contaminant loadings into Lake Erie or ambient water concentrations. Consequently, contaminant problems may be difficult to detect without consideration of the data in context with the entire ecosystem. The collection of food web contaminant data, the development and application of food web models, and the maintenance of monitoring programs are all essential for the effective management of the Lake Erie system. Key bioaccumlative chemicals identified were discussed at this meeting. These included PCBs, furans etc. Most work has been done on organochlorines especially PCBs, followed by pesticides. From 1970-1980, there was a lower concentration of contaminants in Lake Erie biota compared to other Great Lakes, leading to lower levels of toxicity to Lake Erie animals. Loadings to Lake Erie are similar to the other Great Lakes. Lake Erie is approaching eutrophic status. High productivity decreases bioaccumulation and the fast growth rate of animals decreases the lipid content. In the 1990s, we witnessed a decrease in phosphorous loadings and the introduction of Dreissenids caused a decrease in trophic status. When we look at fugacity ratios and log Kow we see that equilibrium dynamics are not occurring. This suggests that the base of the benthic food web is more contaminated than the base of the pelagic food web. There are increases in contamination exposure. Spatial variation- Herring gull eggs from the Detroit River had the highest concentrations of DDE and PCBs, compared to other biota. Koslowksi et al. (1994) studied PCBs in food webs. Three PCB congeners are hydrophobic and biomagnify up food web. Francis et al. (1989) demonstrated that mercury biomagnifies up the food web. Compounds are susceptible to metabolic degradation. PAHs are higher in lower trophic levels than in higher trophic animals. PAHs are metabolized quickly in vertebrates. Biomonitoring- PCBs in walleye monitored between 1977 and 1982 showed a decline in PCB concentrations. Young-of-the-year spottail shiners show a general decrease of contaminants from mid 1970 to mid 1980. Biomonitoring needs to continue to accurately assess temporal trends. PCB temporal trends in herring gull eggs decrease over time and have not slowed in the mid 1990s (unlike data for fish). One hypothesis for the lack of decline in lake trout may be due to a change in food web structure. We are seeing a continued decrease in gulls due to diet change. There is also a decrease in the smelt population which has caused lake trout to switch to less toxic food. There is a weather pattern influence for gulls as well as changes to prey population and breeding habits. Monitoring does not necessarily represent changes to contaminant loadings. Modelling: PCB food web models evaluated the effects of invasive species and weather patterns. The Lake Erie Ecological Modelling project was a mercury cycling model used to predict concentrations in Lake Erie. Future Trends and Research Needs Studies are needed for new, emerging-issue chemicals. We need to collect food web data and initiate monitoring programs using lower trophic levels. We need to develop and apply food web models. SUMMARY AND RECOMMENDATIONS: Contaminant Processes in Lake Erie Session and Workshop Findings Scott will lead off and take questions on grievous concerns. Scott will present a summary of sources and loadings information, as updated from this session, plus the findings from the Millennium workshop on contaminants in Erie, PA, during June, 2000. The most important take home message is that the data suggests most loadings are dominated by diffuse nonpoint inputs. This information comes from Dave Dolan, but it is relevant for many compounds here. Loadings are still driven largely by nonpoint source diffuse inputs. Consequently, ambient quality is driven by nonpoint diffuse inputs be they agricultural or industrial sources. Local water quality is influenced by local land use. The good news from this is that we know where to look for problems and solutions, e.g., atrazine. So when we go out and look for atrazine concentration in various places, we see that the highest concentrations are in lakes and streams, in places adjacent to areas of highest use (e.g., Thames River). As you move across the St. Clair River and into Lake Erie, you get progressive dilution because there is more use in the US. The concentration of use is highest on the US side. GIS mapping is an excellent tool and already shows the distribution of chemicals and zones influenced. -for source cahr. The data was compiled from US point sources, the Toxic Release Inventory (TRI), the Permit Compliance System, as well as Canadian point sources including the National Pollutant Release Inventory (NPRI) and the Municipal/Industrial Stormwater Abatement (MISA) program. We also included information from tributaries, the Federal database STORET, PWQMN, HYDAT, and atmospheric data from Integrated Atmospheric Deposition Network (IADN), and the Mercury Deposition Network. It took a consultant almost a year to sort out the industrial data. This is an example of metadata analysis (number of facilities, number of observations, and the percent reporting). The cutoff limit was that if it had 25% detects or more, we couldn't establish the loads. The equivalent US list gave the same conclusion. We looked at tributary information and here we had a list of compounds, the number of samples in various programs, and numerous sites. The data is from only 5 locations. Most importantly, the majority of observations had a detection limit of 25 percent or more. Here we dead-ended. Conclusions One primary conclusion is that using the existing tributary and point source data available, it is not possible to compute the loads for contaminants of interest. This was true for the entire watershed all the way up to Port Huron. However, the data could be used for source trackdown. This will not be discussed in this talk due to time constraints. We must continue to strive for a full review of contaminant data, collections, and methods, as well as pursue monitoring trends and status programs. It became apparent that we need an institutionalized and centralized database for the Lake Erie basin. This would provide an information clearing house, storage, distribution management, and integration point for data. Contaminant Factoids PCBs and mercury are the current critical pollutants linked to fish consumption advisories. For dioxin, 40% of the lake wide sediment has exceedances of the PEL. Dioxin is also responsible for fish consumption advisories. There are PEL sediment exceedences of lindane (54%) and anthracende (32%) on a lakewide basis. Anthracene was present in surficical sediment concentrations. The additional message with PAHs, is that they are on the increase and the spatial distributions (10H PEL) were found near industrial sources. Benzo(A)Pyrene coming out of Lake Erie is much greater than the amount in the Lake Huron outflow. There is a significant increase in time trend. Nitrates are increasing and amounts are much greater along the US side than Canadian side of Lake Erie. Concentrations in most tributaries are at 0.25-0.5 mg/L. Lake concentrations, greater than 1 mg/L, is a concern and have implications for amphibian, wildlife, and even fish populations. Future Trends and Research Needs There is agricultural use of chemicals that are suspected to be endocrine disruptors. Lake Erie is downwind and downstream of an incredible amount of materials. Also, the Canadian equivalent shows that 99% of emissions are from air, and not water. Dick Sayre showed a map of Lake Erie. Each map shows a different pattern with a message about how and/or where to deal with the problem. I suspect that there will be compelling evidence that although you can't compute loads, you can provide management with a focus. Russ: I would like to make a couple of points and then wrap up this session. Today we have seen big picture thinking over time and space. We have heard a great number of findings and recommendations for monitoring and managing contaminants on Lake Erie. We have heard about the Huron-Erie corridor, the impact of the Detroit River on Lake Erie and suggestions for management. I would like to invite everyone to the session tomorrow on the influence of the Detroit River on the Lake Erie ecosystem. |
| Back to Top |
Research and the Role of the IJC
Mark Burrows
International Joint Commission, Secretary to the Council of Great Lakes Research Managers, 100 Ouellette Ave. 8th Floor, Windsor, ON N9A 6T3
|
The Council of Great Lakes Research Managers was created by the International Joint Commission (IJC) in 1984. Their role is to enhance the ability of the Commission to provide effective leadership, guidance, support, and evaluation of Great Lakes research as it applies to the provisions of the Great Lakes Water Quality Agreement of 1978 (GLWQA). Council initiatives include networking through the Research Inventory and workshops, for example the Modelling Workshop on March 29, 2001 as well as promoting communications, cooperation, collaboration, and coordination between researchers, agencies and the Parties. They encourage the preparation and dissemination of syntheses of research findings. The Council identifies and prioritizes research needs, identify gaps and encourages the Parties to shift funding towards studies directly relevant to the GLWQA's purpose. The Council is reviewing the impact of research recommendations made by itself, the Great Lakes Science Advisory Board, the Great Lakes Water Quality Board, and the IJC. They are compiling and summarizing current and planned research programs related to the GLWQA and Annex 17. Through their role in coordination they scope out emerging issues, prioritize research needs, and press for adequate funding for research. They produce a number of reports including a biennial report on priorities and progress, and white papers on special topics. You can access the research inventory from the Council web page. There are currently about 618 studies listed in inventory. Council web page has link to everything http://www.ijc.org/boards/cglr(.) We also invite you to take part in the Modelling workshop March 29, 2001. |
JEFF BUSCH
Lake Erie Commission, One Maritime Plaza, 4th Floor, Toledo OH 43604
|
The Lake Erie Protection Fund (LEPF) has been in existence for 10 years, and has funded 8 million in research projects usually at $1-1.3 million in projects per year. The LEPF receives monies which is made available for small local projects. The Fund is supplemented by revenue from the license plate program, and grants are given from this revenue. The LEPF targets small start up research projects. They provide seed money and work directly with the Ohio Sea Grant. They have two funds, a small fund that provides approximately $19,000 per year at any time of year and larger grants for research projects. The larger grant projects fund research and implementation and are on a two years cycle. They provide up to $100,000.00 or possibly higher up to $1/4 million in funding for these projects. The LEPF only provides funding for institutions within Ohio, but it is possible to get around that by collaborating with Ohio institutions. For example, they funded a Microsystis project with Dave Culver who put together a team including researchers from the University of Windsor. So far money has been put towards researching the changing Lake Erie ecosystem, bioaccumulation of toxic compounds, trying to find sources of E. coli on beaches, and fish stocks, particularly walleye and yellow perch. The index identified existing problems and developed a plan for addressing problems. It is Ohio's attempt at implementation of the LaMP in the state of Ohio. They recently released a Lake Erie Protection and Restoration Strategic Plan. This document consists of 84 strategic actions that are environmental, recreational, etc. that have been accepted by agencies and the Ohio Governor for implementation. They are currently in the process of assigning a strategic coordinator for the program. They report annually to the citizens of Ohio. In the last request for proposals, the LEC supported projects that support the implementation of the Strategic Plan. They are committed to implementing the plan. The proposal must pass the one paragraph test and indicate how the money will protect and restore Lake Erie. They primarily fund action-oriented projects that result in definite improvement. They are always looking for collaborative efforts in the Great Lakes. http://www.epa.state.oh.us/oleo/lepf1.htm |
| Back to Top |
Research and the Role of the Lake Erie LAMP
MURRAY CHARLTON (For Harvey Shear)
National Water Research Institute, Environment Canada, 867 Lakeshore Rd., Burlington, ON L7R 4A6
|
Harvey Shear's group is fully responsible for the Great Lakes program. There are research opportunities with Environment Canada. Environment Canada is not a granting agency but there are opportunities to work collaboratively i.e. Lake Erie LaMP and SOLEC. The LaMP process has identified numerous research needs. These include: nonindigenous invasive species, climate change, endocrine disrupters, phosphorous revisited, and long range transboundary air pollution. SOLEC developed 80 indicators of ecosystem health and 32 indicators requiring further research. More work needs to be done in this area. Indicators are being assigned to tiers based upon the amount of appropriate information known about the indicator. For example, bald eagles and contaminants in edible tissues are Tier I, whereas, indicators using prey fish require more understanding. Future Trends and Research Needs We need a standardized methodology to design a survey for bullhead. We need a binational coordinated effort to compute phosphorous loads to the Great Lakes or at least to Lake Erie. Ended at 5:35 on Wednesday, March 28 Conclusion until 8:30 am Thursday morning |
Research Workshop – The Influence of the Detroit River on the Lake Erie Ecosystem
ATMOSPHERIC DEPOSITION AND NUTRIENT LOADINGS TO LAKE ERIE
DAVID DOLAN1 and Mark Cohen2
1University of Wisconsin – Green Bay, Green Bay, WI 54311-7001
2Air Resources Laboratory, National Oceanic and Atmospheric Administration, Silver Springs, MD 20901
Abstract
|
Several major tributary monitoring programs have ended in the Detroit River and Lake Erie. Information of this nature was used to prepare Appendix B of the Great Lakes Water Quality Board Report to the International Joint Commission (IJC). The last Appendix B was published in 1989 and the IJC has since lost the ability to prepare such reports. Data is now inadequate to calculate loadings in many areas. No total phosphorous loadings have been published since 1993 and no estimates have been generated for years after 1995. There is no information for total phosphorous loadings for the last six years. Loadings have likely increased however due to population increases, increased flows into the wastewater treatment plants, and increased run-off from agricultural areas during "wet" years. A proposal has been made to US Environmental Protection Agency, Great Lakes National Program Office to bring these loadings up to date. Atmospheric deposition and emission maps of dioxin and atrazine to Lake Erie were presented. Future Trends and Research Needs We can speculate that loadings are increasing and will continue to further increase with population increases. For instance, the southeast Michigan population was 4.59 million in 1990 and is projected to rise to 5.37 million by 2030. |
THE DETROIT RIVER AS A CHEMICAL LOADINGS SOURCE TO LAKE ERIE
G.D. HAFFNER1, R.G. Kreis2, K.G. Drouillard1, M Tomczak1 and S. Reitsma1.
1Great Lakes Institute for Environmental Research, University of Windsor, Windsor, ON, N9B 3P4.
2US Environmental Protection Agency, Large Lakes Research Station, 9311 Groh Road, Grosse Ile, MI 48138
Abstract
|
The Detroit River, one of 42 designated areas of concern, has been classified as one of the most polluted rivers in North America. This system receives chemical loadings from a variety of sources including upstream discharges, industrial/municipal point sources, combined sewage outflows, non point sources and re-suspension of historically contaminated sediments. Despite the rapid discharge rates (5800 m3/s) and short residence times (19-21 h), water concentrations of several organic contaminants (PAHs, PCBs and organochlorine pesticides) and trace metals, many times, increase from headwaters to the mouth of the river. Lake Erie receives approximately eighty percent of its water inflow, an estimated 1.4 x 10⁶ t of sediments, and a substantive influx of chemical loadings from the Detroit River each year. The long-term records of organic contaminant and heavy metal loadings from the Detroit River to Lake Erie are rather limited. Some of the best trends for heavy metal loadings indicate long-term declines for lead, copper, and zinc. Loading estimates for organic contaminants (e.g., PCBs) are even more sparse but suggest a long-term decline. The effects of these apparent load decreases on Lake Erie are casual and are not necessarily well-documented in terms of reduction-recovery; however, decreases in Lake Erie sediment concentrations, contaminants in fish, and recovery of mayfly populations may be indicators of improvements. In this study, we summarize the results of water biomonitoring surveys (1996-2000), sediment surveys (1999) and food web sampling surveys (1991-2000) performed along the Detroit River length and contrast these data with a reference site located at Middle Sister Island (MSI), in the western basin of Lake Erie. Biomonitor estimated water concentrations of tPCBs and tPAHs averaged 0.7±0.2 and 202±16 ng/L throughout the Detroit River, similar to concentrations determined at MSI (0.64 and 304 ng/L, respectively). Sediment tPCBs and tPAHs exhibited pronounced chemical gradients along the river length, increasing from 1.1±0.8 and 14±4 ¼g/g OC wt at headwaters to 5.0±1.2 and 404±32 ug/g OC wt. at the mouth. The latter values were similar to the MSI site which exhibited sediment tPCB and tPAH concentrations of 3.07 and 217 ug/g OC wt, respectively. Elevated sediment/water fugacity ratios (ranging from 3 to 10 for various organochlorines) observed at each site highlight the importance of sediment entrainment/re-suspension towards contaminant flux along the river and as a loadings source to Lake Erie. Interpretation of the above datasets to estimate annual Lake Erie loadings rates, requires the development of calibrated hydraulic models. The development of a Detroit River hydraulic model, its application, and validation of model predicted loading rates using appropriate sampling and monitoring designs are to be discussed. It is apparent that the Huron-Erie corridor should be considered a "Management Unit" and monitoring, modelling, and decisions should be made on a corridor-wide basis. Russ Kreis Can we demonstrate the influence of the Detroit River on Lake Erie? One example is 2,4 di-tert-pentylphenol (2,4 DP). The only manufacturing of this chemical in the Great Lakes occurs along the Detroit River. This chemical is found throughout sediments in Lake Erie, with highest concentrations occurring in the western basin, decreasing through the central and eastern basins, and is now found in Lake Ontario. This demonstrates the interconnectedness and strong influence of the Detroit River on Lake Erie. The total PCB load estimates for the Detroit River provides about half the load considering all other sources to Lake Erie. There are PCB sources upstream of the Detroit River as well. The same is true for other toxins. The Areas of Concern (AOC) such as the St. Clair River, Lake St. Clair, Clinton River, Rouge River, and Detroit River all connect. Half or more of the mercury loadings to Lake Erie are from sources upstream of the Detroit River. The Detroit Wastewater Treatment Plant and upstream inputs are the greatest contributors of PCB loads to the Detroit River and Lake Erie. For mercury, there is about equal input going out from other sources. Dynamic deposition and resuspension of sediment is also a factor. The range of loading is 0.3-1.6 kg/d, to a maximum of approximately 600 kg/yr down the Trenton channel to Lake Erie. Doug Haffner When determining water residues we may need to look at different forms of chemicals in the area to get the whole picture. This includes bioavailable fractions, dissolved fractions, and total loads. When comparing the liquid-liquid extraction versus the bioavailable portion from mussel extraction, a great portion of the PCB (9.6 ng/L) is bioavailable in the lake with no temporal variability. In 1983, the mean values at the head waters were 0.6 ng/L, compared to 0.4ng/L in 1994. There is an increase in the bioavailable fraction of chemicals in the water phase as you go downstream. This is true for PCBs and PAHs. Sediment residues- Is the Detroit River a source or a vector? To answer this we must ask if things are getting worse as we go downstream. Yes they are, PCBs are entering the system along the Detroit River. In the sediment, the organic carbon phase allows for easier monitoring of chemicals. Trophodynamics of PCB 153 – There is no change of PCB loads in various food webs; three webs and different temporal studies. The Detroit River is driving contaminant dynamics in western Lake Erie.
|
| Back to Top |
DETROIT RIVER HABITATS VERSUS SEWAGE ADDITIONS: ORGANIC MATTER QUALITY AND QUANTITY FOR BENTHIC PRODUCTION
US Geological Survey, 1451 Green Rd., Ann Arbor, MI 48105
Abstract
|
The Detroit River is the origin of nearly all (93%) of the water and much of the contaminants entering Lake Erie (Edwards et al.1989; Environment Canada and US Environmental Protection Agency 1988; Table IX-14). Particulate organic matter in the Detroit River originates from three main sources: aquatic plants produced upstream in Lake St. Clair (151,650 metric tonnes AFDW/yr), additions of sewage effluent from 8 municipalities (25,655 metric tonnes AFDW/yr) and aquatic plants produced in the river (28,480 metric tonnes AFDW/yr; Edwards et al. 1989; Table 3). The difference between the three sources is that effluent from the three sewage treatment plant discharges in Michigan is enriched with contaminants from the more than 700 industries that are permitted to discharge toxic substances, such as zinc, mercury, and polychlorinated biphenyls (PCBs) from their manufacturing processes into sanitary sewers, provided it is diluted adequately, as part of Michigan's Industrial Pretreatment Program (EC and EPA 1988). In the 1980s, the Detroit Wastewater Treatment Plant (DWWTP) was the largest point source of sewage and 20 troublesome, toxic contaminants in the Great Lakes basin and was the largest source of PCBs (1.0 kg/da) to the total load of total PCBs (1.63 kg/da) added to western Lake Erie by the Detroit River (EC and EPA 1988; Fig. IX-21). Often since then and currently, the DWWTP has been and is being operated under court order because it failed to comply with effluent quality and plant operation standards. The 25,655 metric tonnes ash-free dry weight of organic matter, in the form of suspended solids, that is discharged per year by the DWWTP, is therefore laced with an unknown amount of toxic contaminants. Scientists have documented the recovery of burrowing mayflies (Hexagenia spp.) in western Lake Erie from virtual extinction in the 1980s to present populations of approximately 350 nymphs/square meter (Schloesser & Nalepa 2001; Schloesser et al. 2001). The main energy source (food) for such aquatic insect larvae is particulate organic matter. Because mayfly nymphs are sensitive to water pollution, including exposure to toxic contaminants, one could ask: What are the nymphs eating and what's in the food that they eat? Is the carrying capacity of western Lake Erie for mayflies influenced by the supply (loading) of detrital organic matter (food)? and, Will contaminants added by the Michigan Industrial Pretreatment Program to the sewage treated by the DWWTP reduce the abundance and vitality of the burrowing mayfly population or poison the food chain in Lake Erie? Contaminant loadings added to western Lake Erie by aquatic macrophytic plants drifting in the Detroit River have been estimated by Manny et al. (1991; Table 7). A comparison of contaminant loadings from these drifting plants and from suspended solids discharged by the DWWTP (Table 1) reveals that sewage, at least potentially, adds 99% of the total, annual, contaminant load to western Lake Erie in the form of 17,877 metric tonnes of 12 toxic substances. Table 1. Annual contaminant loadings to the Detroit River and western Lake Erie by the Detroit Wastewater Treatment Plant (DWWTP) and macrophytes drifting in the Detroit River (in metric tonnes per year). |
|
By 2002, the DWWTP will have increased its discharge capacity for treated sewage effluent from 1500 million gallons per day (mgd) to 1670 mgd. Coincidentally, since 1999, the Michigan Department of Public Health has issued consumption advisories (warnings) about eating the more than 10 million walleye pike, a popular fish with anglers that migrates from Lake Erie into the Detroit River every year in March-April. Are the increased additions of PCBs in sewage effluent from the DWWTP causing PCB levels in walleye to exceed the standard of 2 ppm, set by the Federal Food and Drug Administration for interstate transport since 1999? Over the next 100 years, as the human population continues to grow in southeast Michigan and the watershed of the Detroit River becomes more urban, I expect that organic matter produced by macrophytes and phytoplankton in Lake St. Clair and the Detroit River will remain the same or decrease and additions of sewage effluent to the Detroit River and western Lake Erie will increase. Can we expect the loading of toxic contaminants in sewage organic matter to increase in the future? Representatives of the Michigan Department of Environmental Quality, Surface Water Quality Division say that the increased treatment capacity of the DWWTP will be used to treat raw sewage that was previously discharged by design directly to the Detroit River through Combined Sewer Overflows and that the DWWTP would therefore load smaller amounts of toxic substances to the Detroit River (Algeroff, 2001). Secondly, in 2000, sewage treatment at the DWWTP removed 85-90% of the mercury and most of the PCBs, owing to mercury and PCB minimization programs (Peace 2001) and other corrective actions being implemented at the plant (cf. Arrigo 2001). Lastly, trend information shows that PCBs in whole walleye from Lake Erie have declined over the past 25 years from more than 2.5 ppm to less than 1.0 ppm (DeVault et al. 1996). So the "General Population" and "Women & Children" are now advised to eat no more than one meal per week and one meal per month, respectively, of walleye over 22 inches in length (Day 2001; Michigan Department of Community Health 2001). Hence, loadings of at least mercury and PCBs to the Detroit River and western Lake Erie and tissue concentrations of PCBs in Lake Erie walleye, may decrease in the future and accumulate to a lesser degree in the fish we consume, respectively. Ecological research needs revealed by this preliminary assessment include: Do mayflies consume detritus from sewage and primary producers or do they select between these two sources of food? Do benthic detritivores absorb contaminants from both these food sources in equal proportion? Will contaminant content increase faster in sewage detritus than primary producers detritus over time? Will detrital contaminants limit the carrying capacity of western Lake Erie for benthos, including burrowing mayflies? What more can be done to reduce contaminants in sewage detritus? When considering sewage versus other sources of organic matter in the Detroit River, the difference is that sewage is richer in contaminants. Scientists have traced the recovery of Hexagenia mayflies from virtual extinction to recovery populations of approximately 350 nymphs/m2. What are they eating? And what is in the food that they eat? The Detroit wastewater treatment plant (DWWTP) is currently in receivership for failing to comply with standards for effluent (contaminants and phosphorous loadings). The DWWTP produces 28,000 metric tons of dry weight of primary producers. This sewage input translates into 26 metric tonnes of suspended solids/year, which is laced with contaminants. The Detroit River had 54.5 metric tonnes/yr produced in the river with more input from up stream. The upper connecting channel data showed that sewage treatment plants produce 17 metric tonnes/year of contaminants to the Detroit River. Of this, 99% is from DWWTP, the single largest point source of waste in the entire Great Lakes basin. The Detroit WWTP has applied to increase their discharge. This would involve the installation of a new diffuser in the Detroit River. A tunnel 21 feet (6.4m) in diameter would be constructed under the river bottom with pipes coming through to the sediment surface. This pipe would output treated sewage and would result in an increased output to 100x106 gallons/day (378.5x10⁶ L/day) or a doubling of output values. Future Trends and Research Needs We expect that macrophytes and phytoplankton populations will remain the same with no big increase in primary production. Sewage treatment plants will increase input of organic detritus contaminated with industrial material. Do mayflies consume detritus from sewage and primary producers or do they select? Do benthos absorb contaminants from both food sources in equal proportion? Will contaminant content increase faster in sewage detritus than primary producers? Will detrital contaminants limit the carrying capacity of western Lake Erie for benthos? What can be done to reduce contaminants in sewage detritus? Sewage pretreatment needs to be looked at. What can be removed in the processing of sewage treatment? |
EVALUATING THE EFFECTIVENESS OF PCB CONTROL MEASURES IN THE DETROIT RIVER-WESTERN LAKE ERIE WATERSHED BASED ON MEASURING ECOSYSTEM RESULTS
Greater Detroit American Heritage River Initiative, 110 Mt. Elliot, Detroit, MI 48207-4380
Abstract
|
Loadings of PCBs to the Detroit River and Lake Erie have substantially decreased since the 1970s. However, the atmosphere and certain other sources continue to contribute loadings. In addition, all Areas of Concern have contaminated sediment. Contaminated sediment is viewed as a universal obstacle in restoring uses in Areas of Concern and Lake Erie. In general, PCB levels in Lake Erie biota declined during the 1970s and 1980s in direct response to reduced loadings. However, PCB levels in Lake Erie biota remained fairly stable during the early 1990s. During the 1980s and 1990s considerable emphasis was placed on minimizing inputs of PCBs from active sources. In addition, between 1993 and 2000 there will have been approximately $100 million in sediment remediation within the western Lake Erie/Detroit River basin (Rouge River - Evans Products Ditch Site and Newburgh Lake; Detroit River - Carter Industrial Site, Elizabeth Park Marina, Monguagon Creek, Black Lagoon; Huron River - Willow Run Creek; River Raisin - Ford Motor Company Site; Ottawa River - Fraleigh Creek). The primary purpose of this project is to evaluate whether or not recent source loading reductions of PCBs and recent sediment remediation (for PCBs) at the above sites have had an impact on ecosystem results (bioaccumulation of PCBs in fish, herring gull eggs, adult mayflies, etc.). This project will bring together available research and monitoring databases to evaluate program effectiveness based on measuring ecosystem results. First, the project will compile summaries of available research and monitoring programs (sources, pathways, and compartments) relative to PCBs. Next this project will quantitatively estimate the mass of PCBs removed, treated, and/or contained as a result of the above sediment remediation projects. A binational forum will be held to integrate research, monitoring, and management in an effort that synthesizes databases, collectively interprets results (relative to ecosystem outcomes), and collectively develops advice (recommendations) for research institutions, monitoring agencies, and management organizations. It is suggested that the results of this binational forum will be will be presented at LaMP and RAP meetings, and further distributed in a report. It is proposed that research results and monitoring data (relative to PCBs) will be provided by the following institutions: Lake Erie LaMP Sources and Loadings Committee (point and nonpoint source loadings of PCBs), Canada Dept. of Fisheries and Oceans (W. Lake Erie fish contaminant data); University of Windsor's GLIER (modelling results and predictions); U.S. Geological Survey (forage fish data base); Canadian Wildlife Service (herring gull monitoring data base); University of Windsor's GLIER (adult insect bioaccumulation data); Michigan Dept. of Environmental Quality (Detroit River fish contaminant monitoring data and sediment data); Ohio EPA (fish contaminant monitoring data); National Water Research Institute (sediment research data); U.S. EPA's LLRS (sediment and fish data sets); U.S. EPA's GLNPO (fish contaminant monitoring); and others. Management institutions involved include: Lake Erie LaMP, Detroit River RAP, the Four Party Agreement for the Detroit River, the Maumee River RAP, River Raisin RAP, Rouge River RAP, and the Greater Detroit American Heritage River Initiative. Again, the intent is to integrate research, monitoring, and management in an effort that synthesizes databases, collectively interpret results (ecosystem outcomes), and collectively develop advice and recommendations for research institutions, monitoring agencies, and management organizations. A final report from this project will be distributed to all interested stakeholders of the above initiatives and will be placed on selected homepages (e.g., Greater Detroit American Heritage River Initiative, International Association for Great Lakes Research, Environment Canada, U.S. EPA-GLNPO) to increase outreach. This proposed project is unique in that it cannot be accomplished without considerable collaboration. It is hoped that this project will be a collaborative effort among all the research and management institutions in the Detroit River/western Lake Erie basin. Thanks to everyone for taking last year to prepare all of this. I support what everyone has said. It's high time we linked the Detroit River to Lake Erie. I am going to propose the next step in the process. If you were a multinational company and spent $100M on a new project, would you want to know if you achieved your objectives? Of course. We're spending that money now, and it's time we answered that question. We have a unique opportunity to couple the Detroit River and Lake Erie in order to evaluate the effectiveness of control measures. This could be great for the Lake Erie Millennium Plan, the Detroit River RAP, and others as well. Much has gone on over the last 20 years to minimize PCBs entering the Detroit River and Lake Erie including treatment control programs and industrial reductions. Between 1994 and 2000 there will have been $100M spent on sediment remediation within the western Lake Erie basin and the Detroit River. We want to know if we have met our objectives. Remediation projects include the Rouge River Evans products ditch site (1997), Newburgh Lake, Detroit River Carter Industrial site, Elizabeth Park marina, Monguagon Creek (1997), Huron River Willow Run Creek (1998), River Raison Ford Motor Co. site (1997-98), Ottawa River, and Fraleigh Creek. All of these projects were completed through the 1990s. Currently there are plans and funding available for remediation projects at the Black Lagoon and Conners Creek in the Detroit River. Some example removal projects are: Rouge River 750,000 m3 of sediment removed including 7,300 m3 of contaminated sediment (PCBs) Newburgh Lake 306,000 m3 Carter Industrial site 35,000 m3 Black Lagoon 30,000m3 Connors Creek 114,000m3
One problem is that we don't know what to do with the contaminated sediment that has been removed.
Future Trends and Research Needs
I propose that the Lake Erie Millennium Plan, Lake Erie Lakewide Management Plan, and Remedial Action Plans (RAPs), could come together and look at existing databases. What are the likely effects that remediation projects had on the biota?
Essential steps
1. Compile some summaries 2. Quantify estimated mass of PCBs removed, treated, and or contained as a result of sediment remediation projects 3. Convene a binational forum to integrate research, monitoring, and management effort that synthesizes databases, collectively interprets ecosystem results, and develops advice for research and management organizations 4. Involve Lake Erie Lakewide Management Plan, Sources and Loadings Committee; Fisheries and Oceans; DWSD; Great Lakes Institute for Environmental Research (adult insect bioaccumulation data; modelling/predictions); US Geological Survey (forage fish data base); Canadian Wildlife Service (herring gull monitoring data base); Michigan Dept. of Env. Quality; Ohio EPA; US EPA Large Lakes Research Station; and US EPA Great Lakes National Program Office. |
| Back to Top |
Workgroup Reports
|
Five breakout sessions were convened at the end of the Conference to synthesize information from the technical sessions and to gain an integrated perspective on certain issues. The breakout sessions addressed: 1) Contaminant Loading, 2) Biomagnification, 3) Habitat Issues, 4) Water Quality and Nutrient Loadings, and 5) Spatial/Temporal Scale and Sampling Design.
Summaries of the breakout sessions and the report out results are provided below. |
|
Moderator: John Hartig
Q. 1 How do we measure and detect changes in loadings?
Priorities on QA/QC for data
We require a central lab so we can perform analyses with the same degree of accuracy and precision
Representative monitoring
Clear objectives are necessary; what frequency and for what change?
Clear questions and objectives from management
Opportunities to learn from monitoring programs and experiences at Niagara, Hudson River, and the Green Bay mass balance study.
Need bi-national standardization
Lack of institutional arrangement for standardization
Opportunity for 4 party agreement for institutional arrangement
Lessons from Green Bay: It can be done Time and resource management is important Ask clear questions Monitoring driven by clear management questions
Learn from Hudson River PCB cleanups
Dave Dolan – quality control on all measurements, for all media
How many stations are needed and how many need to be monitored to detect loadings? Representativeness of the sites;
Marion Diamond- useful to set out objectives from the onset; feasible level and manageable scientifically and politically; sampling program should be supportive of the results you want to get
Joe DePinto- These are potentially different questions. Joe DePinto- PCB modelling only or broader? John Hartig – clear question for management Mass balance-Can’t look at only western basin response but local benefits for other areas
Accepted protocol for sampling between countries or labs on collecting samples and how they are handled? QA/QC – diverted to parties and jurisdictions in 1987 agreement; understanding for cost and out it forward in a unified way to get funding
Ric Coronado- agencies on both sides of the border should agree on the same protocols
Joe DePinto-other ways to monitor – lipids bags, or cheaper ways to same; do they need to be explored?
Hudson river work- source of controversy – hiring expensive people to write papers in support of their view – generating lists of available data, etc.
|
|
Question #2 – system changes expected?
Greater suspended solids, total phosphorous, etc. as from Bruce Manny’s talk
What are the stressors in the system? What are the effects of lake levels etc?
Group is uncertain of question and what to answer. The group would like to pose their own question
*Identifying key stresses on the system: Id key stressors; Population increase; more cars and fewer emissions; alternative forms of transportation; climate change; resource consumption; re-industrialize brown field sites (urban corridor of river) What effect will it have? land use changes; differentiate between point and nonpoint sources and controlling them
Knowledge and understanding driving management opposed to reacting; Transportation planning is driving environmental change staying abreast of what is happening
Past/present/future 1. question/ hypothesis formulation 2. data 3. interpretation 4. decisions and (re-)evaluation
Question #3- how and what would we measure for system change?
Indicators, practical, innovative System indicators Fish bioaccumulation Herring gull monitoring Human exposure Periodic screening for unknowns and emerging problems Benthos work Source loadings Transportation / land use Per capita emissions Ecological foot print
How would you measure effective co-ordination? Redundancy, amount of duplicate programs; takes money to do that. -need indicators for bi-national institutional co-ordination
Question #4 – What are suggestions for high priority management actions to improve the system?
1. We need a Federal RAP co-ordinator with the authority and resources to do the job. We should make the Four Party Agreement into only a Two Party Agreement between the U.S and Canadian Federal governments. 2. Pre-treatment enforcement 3. Accountability of RAP/LaMP actions 4. Detection limits need to be lowered – for self monitoring by companies 5. Accountability-Public reporting on detection limits and monitoring data (or lack of data) by industry – electronic reporting 6. Implications of devolution of higher levels of government to lower governments to deliver on responsibilities are important and not yet appreciated
Question #5 – predictions and consequences of proposed actions? See system changes answers
Proposed by John Hartig:
What should be the next steps for Lake Erie Millenium, LaMP, etc.?
1. Share data and update Upper Great Lakes Connecting Channels Study (UGLCCS) 2. Specific management questions and goals for Monitoring Upper Great Lakes Connecting Channels (MUGLCC) 3. Embrace emerging technologies for sampling (and remote sampling) and technology for monitoring 4. Pretreatment enforcement 5. Lower detection limits 6. Public reporting of loadings – above three are good to do even if you don’t have a specific question in mind 7. Establish a bi-national data quality work group to ensure desired QA/QC 8. Securing long term commitment to all of the above 9. Greater involvement of citizen groups- advocates for monitoring and research 10. We need to provide feedback to citizen groups in a public manner |
| Back to Top |
|
Moderator: Ken Drouillard
Questions regarding loadings
In order to address biomagnification, considerable information is needed including exposure concentrations from different media, loading measurements, and food chain concentrations.
Current foodweb surveys involve monitoring trophodynamics of PCBs in Lake Erie. We didn't find much change with respect to trophodynamics. There has been no change from 1991-2000 and generally some contaminants in tissues may be increasing.
The Detroit sewage treatment plant is the single most important source of PCBs and contaminants. There is no evidence of a declining trend, with an increased capacity, the future loadings are unknown.
With respect to remediation activities and biomonitors, there are a few biomonitoring programs, for example, smaller organisms with rapid responses such as the spottail shiner and mussels. We need to reevaluate biomonitoring programs at WWTP sites, frequency of sampling, and implementation to couple with loading estimates as well as continue supporting long running programs.
How do we measure inputs? Loadings may not necessarily indicate biorelevant concentrations. We need to understand bioavailability.
There needs to be better communication between ecologists and modellers. When performing biological profiling of species movements you often get a data gap. We don't know where an animal is moving to and the specific locations.
Can we link energy flow and ecological stress and biomagnification with models? What are the effect of loadings, and do they detect change? Models can be designed to link ecology with biomagnification including multiple stressors, chemical mixtures, and nutrient changes, species invasions, habitat changes and all run into the mix on how animals respond to multiple mixtures. These, however, are data intensive and have been difficult to perform in the past.
BEAST is a good integrative model whereby you can tie in community response and bioassays together. The herring gull data is a good example of a monitoring data which includes life table characteristics along with bioassays at the tissue levels with biomarkers. We should also examine and look at other examples of key indicator species We keep reiterating how important it is to continue long term monitoring programs, along with adding new monitoring to address specific problems. The herring gull set is the only real long term monitoring set and we need to keep those programs in place. We don't want the same situation with nutrient data where the monitoring programmed stopped and now you can no longer estimate loadings. Biological exposures consider the Huron-Erie corridor as a management unit. We need to integrate spatial and temporal exposures.
|
|
Moderator: Jeff Reutter
Fisheries management Exploitation stocking is important but we don't spend enough time on habitat. As scientists we haven't given managers enough information on the importance of habitat. Habitat information is more qualitative and we need to provide quantitative information. Scudder Mackey’s talk complements the work done by Halta et al. to quantify substrate types. We need a lot more of that type of research. Exploitation stocking - quantitative Habitat - qualitative We must quantify habitat type. Define habitat use- define use or function, need to measure Measure changes in habitat quantity as a result of loadings and function as a result of loading Bring biological and physical managers and researchers together to examine issues. Share needs and information and reduce uncertainties Difficulty in agreeing on uniform sampling methods for comparative analyses
Water and biological pollution We need to better communicate the importance of habitat to the public and policy makers. The public identifies with quality habitats and makes more use of them. We don't do a good job of communicating about the various habitat types or impact. We make it difficult for policy managers to give it the importance it needs. There is a need for predictive measures on impacts/ perturbations and decision support systems for management/policy considerations. Land use change has a tremendous impact on water quality and habitat. Understand and predict changes in function with physical change. Most importantly we must prioritize habitat work and quantification of habitat issues. |
| Back to Top |
WATER QUALITY AND NUTRIENT LOADING
|
Moderator: Murray Charlton
What is being done to measure loads?
Loads will increase with concentration based limits if more flow is treated. Loads may currently be increasing. We require independent verification of loads, self monitoring may not be adequate. There are two examples in Canada of this. The capacity of Lake Erie to handle loadings may decrease with lower water levels. Non-point impacts need assessment because they are likely to be extremely variable. Load Measuring Sewage treatment plants, combined sewer overflows, industry, and total river/system must be monitored. Upstream downstream approach foremost for total river - Go back to panel measurements and get a handle of what's coming in between Lake Huron and Detroit River Issue of detection limits easily solvable but will take effort.
We should settle on a quality program, and begin to treat it similar to a cost of living approach where monitoring increases appropriately. (?) The future is likely to be similar to the 1960s and 1970s again if nothing new is done. We can expect more weed species, more toxic algal blooms, invasive food chain elements. In highly eutrophic environments mayflies are threatened, and organic matter, temperature, dissolved oxygen are out of balance. We have no experience with high nutrients and new species.
With increasing populations of mussels we expect white perch and yellow perch numbers to increase. Macrophytes will decrease and this will be exacerbated by low lake levels. This will cause altered dissolved and particulate contaminant concentrations. It is likely that transient events such as algal blooms will worsen. Storms will cause local effects and these need to be measured carefully. The northern area of the western basin is affected by the outflow from the Detroit River and contaminants then migrate to the southwest and western part of the central basin.
Other needs: - undesirable algae fluorescence surveys for cyano-bacteria remote sensing and primary production model; - biota structure followed enough to monitor trends - process mass balances; and - water quality monitoring.
|
SPATIAL/TEMPORAL SCALE AND SAMPLING DESIGN
|
Moderator: Dr. Russ Kreis
This breakout group addressed the spatial/temporal scale and sampling design of existing monitoring programs. Some recommendations for additional efforts are provided, as well as some issues that require further discussion. Workgroup results were recorded in outline form and are provided below. These discussions were synthesized in a presentation outline form for the reporting out session (also provided below). Breakout, presentation, and other salient discussions and comments are provided in the following text in summary form.
It was identified that monitoring must be conducted with a purpose and there are many purposes and questions to address in monitoring programs. Therefore a series of questions can be asked such as: What are the issues you are trying to address?
Are Lake Erie managers satisfied with the present monitoring and data? Are the questions changing? How shall we address new questions in addition to existing questions? Are we being effective? Are partnerships for discussion and coordination being formed?
There are many different types of monitoring which address different issues and some may have multiple uses and purposes. Some types of monitoring include the following: long-term monitoring for trends, upstream/downstream load monitoring for system mass budgets, point source loading, point source monitoring (compliance), long-term monitoring for status and ecosystem response, load monitoring for mass balance modelling frameworks, short-term assessment monitoring for specific issues, in-stream monitoring for ambient water quality standards and criteria (compliance), pre- and post-remedial monitoring, drinking water monitoring (compliance), exploratory/emerging issue monitoring, among others. It is recognized that these programs may satisfy regulatory/compliance or scientific purposes, but in most cases, the results are a report card and record about whether or not sites, regions, or ecosystems are improving, pursuant to actions taken. It also recognized that monitoring may include air, water, tributaries, biota, and sediments and require different spatial and temporal scales and sample designs. In the context of LaMPs and RAPs, monitoring should be used to address beneficial use impairments, use appropriate indicators and endpoints and include sufficient statistical robustness to determine if an impaired use should be delisted.
Air sampling in the region is conducted under IADN (International Atmospheric Deposition Network) at 4 to 5 sites. The sample design appears to be adequate, however, some the addition of sites could be considered. The frequency and design of water sampling in Lake Erie also appears to be adequate and is conducted on a yearly basis or 2-cycle with representative monthly frequency by GLNPO and EC; these are often complemented by nearshore sampling programs via the province and states. In terms of load monitoring, there appears to be considerable improvements that can be made including frequency, intensity, and analytical limits of detection. Although some programs exist, there are great uncertainties with the limited data and self-monitoring data. Fish sampling and analysis for contaminants in Lake Erie is very good with DFO (lake trout) and GLNPO (walleye) monitoring programs. These are supplemented by province and state monitoring programs for fish contaminant monitoring. The herring gull monitoring program is very good with yearly analyses. Fish creel census methods and data are not well known and the success of this program is uncertain. Sediment sampling for contaminants appears to be on a 5-10 year cycle with good spatial coverage.
Benthos sampling lakewide and with some regional coverages, is on approximately a 5-year cycle and appears to be appropriate. This should be re-examined for cycle, coverage, and coordination of programs. Exotic species are many times observed in different programs and should be evaluated for temporal sampling and coordination. Wetland monitoring programs are patchy, regional and/or sporadic and should be coordinated for spatial and temporal coverage. Because of the importance of the Detroit River to Lake Erie, discussions indicated that the herring gull monitoring program was the premier monitoring program for the River. Sports fish monitoring by OMOE is moderately successful and along with the State of Michigan program, should be improved. Water column and loading monitoring in the Detroit River is deficient. However, a new program on upstream/downstream monitoring has been recently re-established, but is somewhat limited. Sediment sampling is generally on a good cycle but should be improved and made consistent. A general assessment of monitoring programs in Lake Erie shows that these can be rated as moderately successful. There are programs in place and in some cases, coordination is evident. The spatial and temporal sampling designs of lakewide monitoring appear to be relatively good. There are differences in the frequency of sampling due to logistics and variability. The greater the variability in the medium, the more sampling intensity is required. For example, water samples exhibit greater temporal variability than sediment samples. Those programs that are on an annual sampling basis or are recommended to be on this cycle with monthly samples, when possible, include: air, water, and loading. Those on an annual basis include fish, fish census, and herring gulls. Benthos sampling should be on a 5-year cycle. Sediment monitoring is appropriate on a 10-year cycle. Greater spatial coverage, coordination, and frequency cycle must be determined for wetlands. A primary recommendation is that the erosion of the monitoring programs must be stopped. Another primary recommendation is that monitoring must be coordinated whenever possible among agencies and be conducted for a purpose, due to reductions in monitoring resources.
There are several other types of monitoring which will require further discussion and examination. Exploratory scans for emerging contaminants must be conducted; it appears that some scans should be conducted on a yearly basis and should be conducted in water and sediment. These are to address future concerns and potential issues, for example, endocrine disruptors and pharmaceuticals. Exotic species monitoring has typically been conducted on a local/regional basis or species incidentally collected in other existing programs. Discussions and coordination will be required in order to effectively monitor exotic species and particularly for early warning detection. Loading information for many parameters in Lake Erie and the Detroit River is typically insufficient due to sampling frequency, intensity, and analytical limits of detection. These can provide both lakewide and local watershed perspectives on priorities. Loading information and the sampling of ambient concentrations would have to be synoptically conducted to fulfill a mass balance modelling framework and provide a predictive capability. The lack of this approach has hampered management decisions in some cases for over a decade. The use of in-situ biomonitors must be more fully explored. Caged mussels and spottail shiners appear to be reasonable and representative biomonitors for present conditions. Remote sensing and related technologies should continue to be applied for broad regional assessments with ground-truthing. The implementation of pre- and post-remedial monitoring is greatly needed. Post-remedial monitoring must be conducted so that comparisons to baseline data can be made to demonstrate the success and benefit of each remedial action.
|
| Back to Top |
Monitoring for a Purpose:
1. Long term trends
2. System mass budget
3. Point source loadings
4. Monitoring programs for ecosystem response
5. Mass balance modelling framework
Reasons for a monitoring program:
Long term trends
| 1. Monitoring trends | |||||
| a. Address beneficial users | |||||
| b. Water quality changes | |||||
| i. Discharge effects | |||||
| ii. Natural | |||||
| iii. System mass budget | |||||
| iv. Fish monitoring | |||||
| c. Off-shore sediment monitoring EC | |||||
| i. Complemented by near-shore monitoring | |||||
| ii. Ohio complementing | |||||
| d. Contaminant in sediment and water column | |||||
| i. Water column more variable | |||||
| ii. Spatial scales need to be different for the two environments | |||||
| iii. Time integrated monthly sampling being done | |||||
| iv. Passive suspended sediments | |||||
| v. NRRI and Murray Charlton collecting data | |||||
| vi. EC only uses index stations, one per station | |||||
| vii. Shared by different divisions | |||||
| viii. 50 sites west to east, North-south | |||||
| 1. Variability between years | |||||
| 2. Every other year sampled | |||||
| a. water suspended solids | |||||
| 3. All agencies supposed to be coinciding | |||||
| a. Move between lakes each year | |||||
| i. Lake St. Clair this year | |||||
| 4. 5 year cycle on sediments | |||||
| 5. Trends over decades only | |||||
| 6. What management questions can be addressed? | |||||
| a. Can’t compare to immediate changes in Lake Erie | |||||
| b. Depends on medium measured | |||||
| c. Decadal resolution on sediments | |||||
| d. Suspended sediments are different case | |||||
| e. Channel maintenance potential for dramatic short-term sediment effects | |||||
| f. Lower lake levels amplify effect | |||||
| g. 5 year sampling will not find this | |||||
| h. Temporal scale needs to be appropriate to management question | |||||
| i. Long term trends: sediments cheaper and better | |||||
| j. Short term trends: water or organisms | |||||
| k. Detroit waste water treatment plant should be monitored for point of impact on Lake Erie | |||||
| l. Bio-monitoring before and after up and down from remediation projects | |||||
| m. Want to see a change you need to see it immediately in biota and concentration in tissues | |||||
| i. Not monitoring, pre- and post- studies | |||||
| n. Current sampling programs are appropriate to detect long-term trends? General yes. | |||||
| o. USEPA study on fish (walleye), Lake Trout DFO | |||||
| p. Sediments and water upstream downstream probably suitable | |||||
| q. Frequency of sampling within and between years probably sufficient | |||||
| r. Some long-term studies in lakes, now starting in Detroit river | |||||
| s. Monitoring programs important for long-term trends: have that now. | |||||
| e. More management questions | |||||
| i. Sources | |||||
| ii. Before and after | |||||
| iii. Need tighter temporal sampling programs | |||||
| iv. How are you documenting methods for reducing loadings? | |||||
| v. How to identify sites? | |||||
| vi. Implementation strategies | |||||
| vii. Provide research data to identify and deal with sites | |||||
| viii. Prioritizing sites | |||||
| 1. Collect appropriate scientific data to identify sites and methods | |||||
| ix. Spatial scales to determine causes of changes? Do we have that? | |||||
| 1. Generally yes, just dealing with cleanup? | |||||
| 2. No management decisions for regulating PCBs etc. decision are already made, now dealing with cleanup | |||||
| 3. Significant point source loads aren’t as important as in the past | |||||
| 4. Now finding and eliminating contaminants | |||||
| 5. Programs now deal with ecosystem health and loadings | |||||
| a. Agencies moved away from load to healthy ecosystem | |||||
| b. Healthy system at mouth of each entrance gives healthy lake | |||||
| c. Look at biota in lake or at river mouths? | |||||
| d. Are health of input points more important than health of lake centre | |||||
| x. Can’t ignore all loading issues | |||||
| 1. Look at new compounds, haven’t identified all toxins | |||||
| 2. If load is significant to Lake Erie for protection purposes | |||||
| 3. Pollution prevention rather than cleanup | |||||
| 4. Priorities: where do you start? | |||||
| 5. Lake sees loads, local systems see concentrations | |||||
| 6. Flows at sites are important in lake as loading | |||||
| 7. Major tributaries are important | |||||
| 8. Are programs in place to monitor tributaries? | |||||
| a. Can we identify major sources? | |||||
| 9. Analysis of ambient programs, regulatory point source programs | |||||
| a. What programs for cleanup? | |||||
| b. There is a hole in programs | |||||
| c. No-one is looking for sources | |||||
| d. Ambient environmental impacts with no knowledge of source | |||||
| e. Need to identify sources! | |||||
| f. Cleanup right places | |||||
| g. All data needs to be in common platform to arrange a co-ordinated program | |||||
| h. Detection levels, scale etc. | |||||
| i. Need to know needs of decision makers | |||||
| j. Questions always change and programs are re-evaluated | |||||
| k. Don’t rely upon data from self-monitoring sources | |||||
| l. Data not in form that will be of use | |||||
| m. Always do own monitoring or go to monitoring agencies and inform of inadequate data | |||||
| xi. Point sources and extrapolations for lateral extent | |||||
| 1. Done in Maumee River | |||||
| 2. Distribution of sediments from contaminated sites | |||||
| 3. Don’t really know aerial extent of concentrations | |||||
| 4. Decadal trends not important | |||||
| 5. Need more spatial information for sediment remediation | |||||
| 6. Keep collecting more data to fill in holes in knowledge to gain enough info for pre-monitoring | |||||
| a. Is it patchy or uniform? etc. | |||||
| 7. Each piece of data raises more questions | |||||
| 8. Hard to assess natural variability in disturbed systems | |||||
| 9. Need to have site specific designs for remediation programs | |||||
| xii. What can be done to improve western basin of Lake Erie | |||||
| 1. Need to clean up Detroit waste water | |||||
| 2. Reduce suspended solids from Maumee system | |||||
| a. Green belting, alternative fill | |||||
| 3.Could monitor trend of change in western basin | |||||
| 4. Program exists for Maumee River as different fills are used | |||||
| a. Changes in elements monitored | |||||
| xiii. Ecosystem response monitoring | |||||
| 1. NWRI monitoring program? Every year once a month looking at contaminants and suspended sediments | |||||
| a. Different programs of EC complement each other | |||||
| b. 20 stations once a month (GLNPO) in summer through middle of lake | |||||
| c. Communication problems? Need to co-ordinate programs. Who’d doing what, where, when? | |||||
| d. Data dumps periodically | |||||
| e. IADN? Four or five sites? Should it be intensified? No. Adequate | |||||
| f. DFO fish contaminant programs: OMNR sport fish, zonation, one level down from DFO. | |||||
| g. Fish information is published annually. Fish consumption advisories still exist. | |||||
| h. Spot-tail data provides low level spatial response. 30 sites in 1970s. Few index sites after non-detection limits reached in 1980s. Point sources all cleaned up. Look for new sites. Good spatial resolution. | |||||
| i. Decadal scales: are they adequate to make management decisions? | |||||
| i. Depends on element | |||||
| ii. Delay in response time | |||||
| iii. Would site specific studies make response faster and more efficient? | |||||
| j. Modelling aspect: predicting distribution and movement | |||||
| i.Are current sampling sites sufficient for model development and verification? | |||||
| ii.Existing programs to do mass-balance construct may need to enhance water, sediment, fish collection. | |||||
| iii.Main need is in loads. | |||||
| iv.Long-term trends and changes are pretty good. | |||||
| v.Mass-balance for lake Erie would be very helpful. May need to enhance programs for a few years. Loadings are under studied. | |||||
| vi.Need coordinated sampling in all media with best detection levels possible. | |||||
| vii.Only useful if management is using this data for pollution detection, prevention: they aren’t! | |||||
| viii. Provided you don’t have enough of a contaminant stored in sediment that can be redissolved and there isn’t a high enough atmospheric then ecosystem health can be appropriate (e.g., PCBs) | |||||
| ix. For other contaminants may need other approach. | |||||
| x.Short-term and emerging issues studies using caged mussels. | |||||
| xi. Start thinking about other compounds that should have been monitored ten years ago | |||||
| xii. Need to do monitoring research on new compounds | |||||
| xiii. EDC maps: look at which pesticides and industrial chemicals are potential EDCs and where are they used? | |||||
| xiv. Experimental lakes are starting studies using EDC contaminants added to entire lakes. Have done enclosure experiments. (EE2) | |||||
| xv. Does phenomenon exist? Can be agree on what needs to be measured? | |||||
| xvi. Look for effect and then try to find the problem | |||||
| xvii. Look at biota to identify problems | |||||
| xviii. Should be more biota monitoring | |||||
| xix. Is there any mio-benthic monitoring in Erie? NO. | |||||
| xx. Europe has used mio-benthos to monitor stream inputs | |||||
| xxi. Anything that should be monitored on decadal scale? 1. Newer compounds need to be found sooner than that 2. Ask for results on every possible chemical possible from samples 3. Try to identify new contaminants. | |||||
| xxii. Fish monitoring? Lake committees. Need to ask them if the studies are adequate. Bi-national, multi-agency. Presume they know what is going on. | |||||
| xiv. Exotic species | |||||
| 1. Are our studies adequate to detect new invasions? | |||||
| 2. More of a habitat issue | |||||
| 3. Needs to be done on a yearly basis. | |||||
| xv. We believe we have the appropriate partnerships and committees (in corridors and lakes) to discuss issues with respect to co-ordination of monitoring. | |||||
| xvi. There is a process to discuss | |||||
| xvii. Do we need to look at coastal wetland changes? | |||||
| 1. Needs more work | |||||
| 2. Need to make more use of remote sensing and automated data loggers | |||||
| 3. Habitat subcommittee is looking at coastal habitats for all Great Lakes using radar, satellites | |||||
| a. Looking at substrate types, etc. | |||||
| b. process is in place to discuss, tweak, manage | |||||
| xvii. Needs to be co-ordination between all committees. Share awareness of who is doing what. | |||||
| xix. Are we making a difference? Are we improving ecosystems or only changing systems? Why bother spending the money? | |||||
| xx. Can’t justify local cleanups when looking at the big picture. Need to look at local scales. | |||||
| 1. Is there monitoring to ensure that cleanup programs are effective? | |||||
| 2. Collect pre- and then post- data. | |||||
| xxi. For loads you need 100 observations per site to identify loads! | |||||
| 1. If you fix a situation then the load to the entire lake will decrease | |||||
| 2. Ecosystem health only requires 1 observation! | |||||
| 2. Presentation Outline for Reporting Out Session: | |||||
| a. Long-term studies | |||||
| b. Monitoring requires co-ordination on several levels | |||||
| c. Loading issues: we are not monitoring loadings because we want complete removal but for comparisons and establishing priorities | |||||
| i. Need to put all the info together (conc., loadings, mass-balance) | |||||
| ii. Site specific studies require pre- and post- studies to assess effectiveness of cleanup studies | |||||
| iii. Site-by-site cleanups | |||||
| 1.Need to point out that cleanups of one site can’t be justified by fixing lake, but cleanups at 50 sites can. These must be done within a systematic and comprehensive plan | |||||
| 2.Monitoring programs should be set up to detect effects of multiple cleanup efforts | |||||
| 3.Modelling approach may provide picture of cleanup improvements | |||||
| 4.In a remediation phase | |||||
| a.Need to demonstrate that remediation decisions actually worked so that future remediations can be justified | |||||
| b. Already into the next group of future compounds for concern, we just haven’t realized it. | |||||
| c.The only management decisions for PCBs are in hotspots, not lake-wide | |||||
| Back to Top |