Human Population Growth
Readings: p. 4-5 text, plus
Myers et al. (2002) Nature paper on Biodiversity hotspots
Before
we can address specific conservation issues, it is important to understand why
conservation problems exist. Species have become extinct during five major
extinction events, with large numbers of families, genera and species wiped
out. However, these events usually were followed by periods of radiation of taxa,
resulting in new diversity. The
difference today is that factors adversely affecting are human-mediated and,
secondly, are occurring at an extremely rapid and accelerating rate. Here we will address population growth of
Homo sapiens, determine where growth is most focused, and identify how human
growth patterns correspond to centres of biodiversity
['hotspots'].
Population growth (pg. 4-5)
Population
modellers use different methods to assess population
growth. Two models that you should already be familiar with are exponential
growth and logistic growth. With exponential growth, the population rate of
change is constant through time, while growth of the population is
geometric. We are most familiar with exponential growth from pathogenic
bacteria and other microorganisms which appear to grow unhindered - that is,
when there is no adverse feedback on population growth rate caused by
increasing population size and its concomitant reduction in remaining resources
and waste buildup:
dN/dt = rN and Nt = N0ert;
where: r is the
intrinsic growth rate, t is the
growth interval considered and N is
population size at different times.
Population growth of this
manner cannot continue indefinitely because even organisms as small as bacteria
experience some form of feedback (e.g. a reduction in fission or birth rate, or
an increase in death rate either because of waste build-up or resource
depletion).
Logistic growth adds this
feedback term to the equation of growth rate:
dN/dt = rN([K-N]/K) or Nt
= K/(1+ea-rt)
where: a is an integration constant to define position on
curve relative to origin, and K is the environmental carrying capacity. Many
species are capable of logistic growth, thought actual growth rates vary
tremendously among taxa. For example, a bacterium growing in a
egg-salad sandwich in the hot sun will divide every ~22 minutes; within 10
hours this single bacterium will have produced 1,072,200 progeny. Prolific
bacterial growth may provide enough of an inoculum to
cause food poisoning.
We
can draw an analogy between prolific bacteria and human population growth, as
well as to its consequences. Human population growth is affected by natality and mortality rates. Throughout our history,
mortality rates have kept population growth at a relatively low exponential
growth rate of about 0.002% per year. Disease and famine were particularly
important because of unsanitary conditions and absence of medical care. As humans shifted from hunter-gatherer to
more modern forms of agriculture, famine became less of a problem and required
less manpower. Nevertheless, the population did not achieve 1 billion until
around 1800; it took an additional 130 years to hit 2 billion, but only 45
years to double yet again (~1975). The world's population is currently growing
at a mean rate of 1.41% per year, down from 1970 when it peaked at 2.07%.
Most
of these increases were due to compounding of growth and to lower death rates.
One of the highest rates observed in recent years was in Kenya (4%), but even
here growth rates are coming down (from 7.7 to 6.7 kids per female). As we
shall see, growth rates differ dramatically depending on whether the country is
affluent (More developed countries [MDC]) or poor (less developed countries
[LDC]).
see statistics for MDC's vs. LDC's
AIDS
and other diseases may impact growth rate statistics in many countries, though
particularly in LDC's because many of the infected
people are females of child-bearing age.
Tragically, many developing countries, in Africa in particular, have
exceptionally high rates of HIV infection (reported estimate of 25% of the
adult Zimbabwe population). Owing to the virtual absence of therapies used to
treat infected individuals, these countries are likely to experience very
significant demographic and social upheaval associated with HIV/AIDS-related
mortality. This tragedy will impact local and perhaps even global rates of
population growth.
Why
do we care so much about population growth?
Simply put, each individual has an environmental
‘footprint’, the size of which depends on factors like country of
residence etc. More mouths necessarily
mean a greater demand of environmental resources. For example, Postel
et al. (1996) estimated that the global human population now utilizes 54% of
water runoff that is geographically and temporally available. Of course, access to potable water varies
tremendously on a global basis.
Construction of dams is projected to increase runoff available for human
use by 10% over the next 30 years, but human population growth during this
period could be as high as 45% (Postel et al.
1996). So, where will the water needed
for these people come from?
At
the same time that our use of the environment increases, our adverse effects on
it are also building. For example, Vitousek et al. (1997) showed that application of nitrogenous
fertilizers have increased dramatically since the 1940s, and together with
other forms of human-mediated N-release, has caused a doubling of the amount of
nitrogen entering the land-based N-cycle.
As an often limiting nutrient (and pollutant), this increase has a
number of adverse consequences including acid rain, loss of soil nutrients (Ca,
K), smog formation in cities, and eutrophication of lakes and seas. Thus, human population growth has very
profound consequences for the characteristics of our environment.
Sisk
et al. (1994) analyzed the correspondence between two measures of population
pressure (growth rate, logging rate) and two measures of biodiversity (number
of species and endemism rate in mammals and butterflies). They then
identified countries that fell in the top quartile for one of each of
population pressure and biodiversity. Biodiversity and endemism tended to
be highest in tropical countries, notably islands. Population pressures
varied from region to region, with deforestation most important in countries in
Central (Costa Rica, Guatemala, Nicaragua) and South America (Columbia,
Ecuador), and human population growth in eastern countries (Sri Lanka,
Philippines, Taiwan, India). Africa had high deforestation rates (Ivory
Coast, Angola, Kenya) and human population growth
(Nigeria). Madagascar (Malagasy Republic) is considered of continental
but not global importance. Europe and North America do not fit into any of the
categories of risk.
See human population growth
vs. biodiversity in:
6)
human population pressure vs. endemism rate
Refer to Myers et al. (2000)
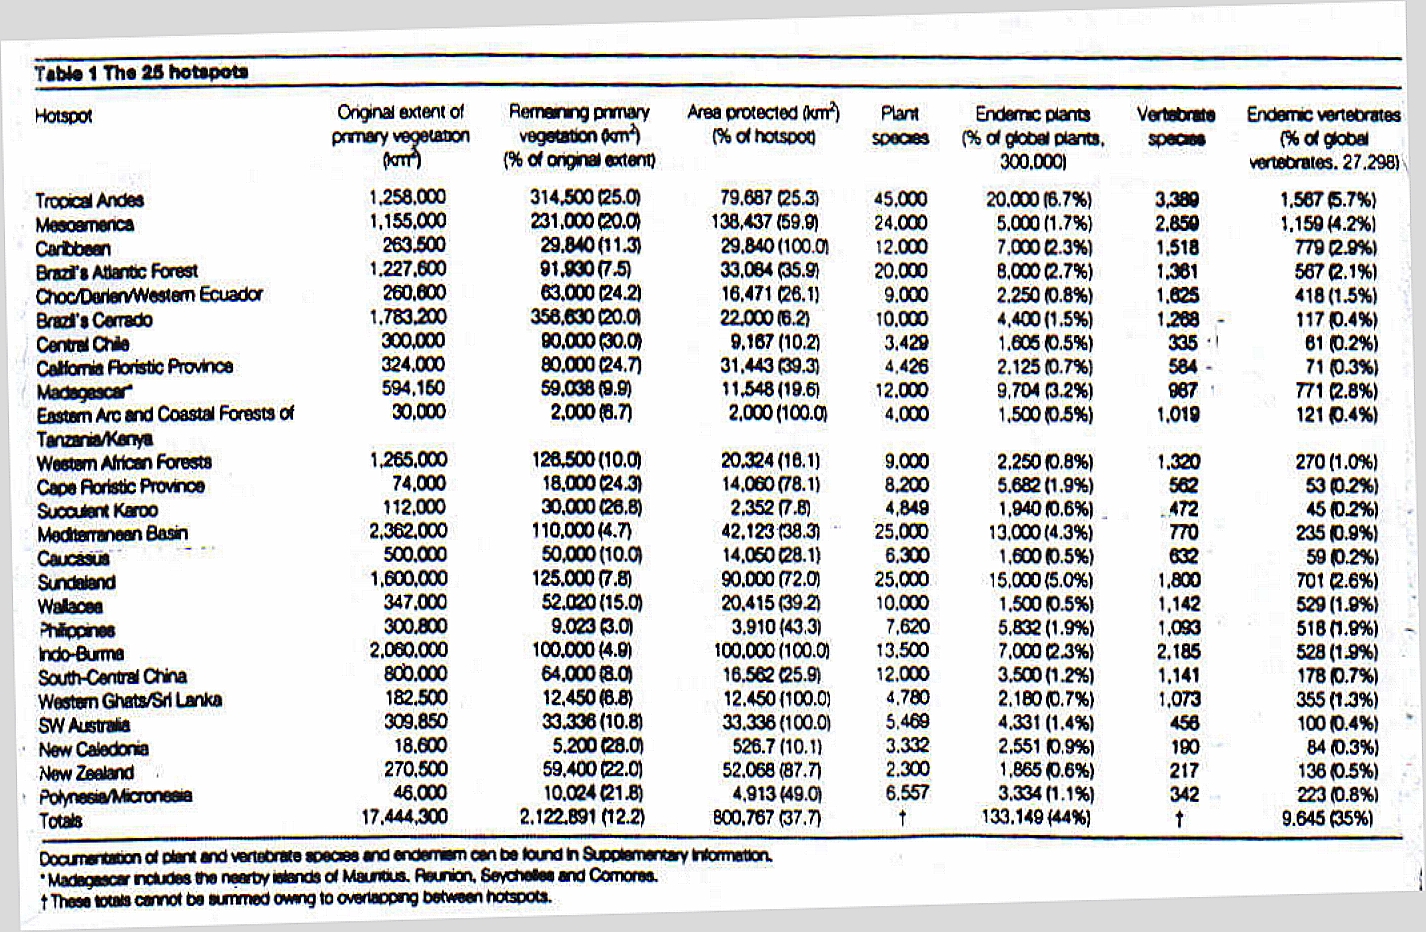
In
a more recent analysis of the same topic, Myers et al. (2000) reported slightly
different results. They used information on plant species, specifically, they looked at regions that contained a
minimum of 0.5% (1500) of the world's plant species as endemic. They then
looked at habitat destruction rates for these regions, and only those with
destruction rates >70% qualified as important and at risk. They
identified 25 regions or hotspots of biodiversity.
Myers
et al. Table 1 - Hotspots
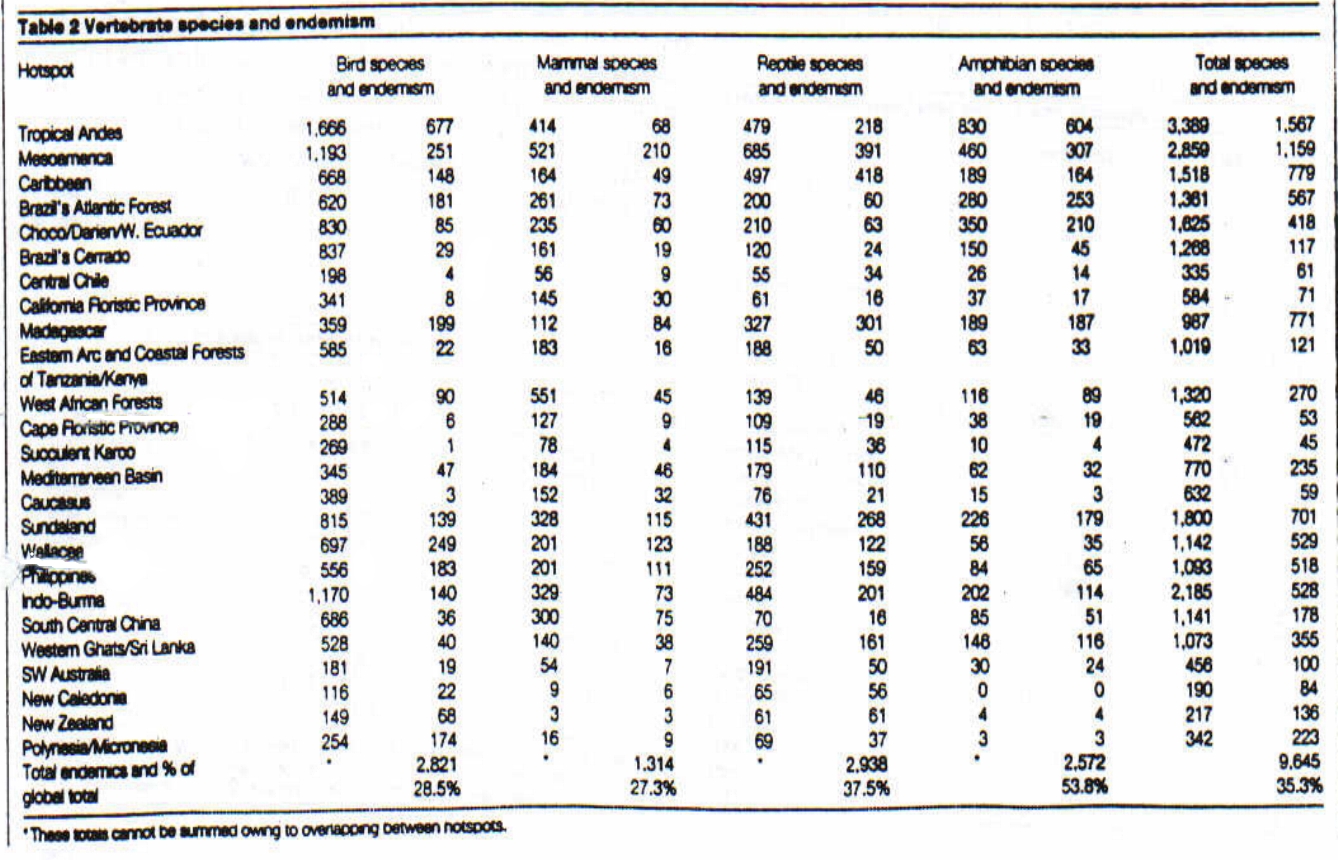
Remember they based their
analysis on plants. However, if we preserved these 25 hotspot areas, we
would also preserve 28.5% of global bird diversity, 27.3% of mammals, 37.5% of
reptiles, and 53.8% of amphibians in addition to the 44% of plants. So,
by protecting plant hotspots, we also protect other taxa.
See
Myers et al. Table 2 - other taxa
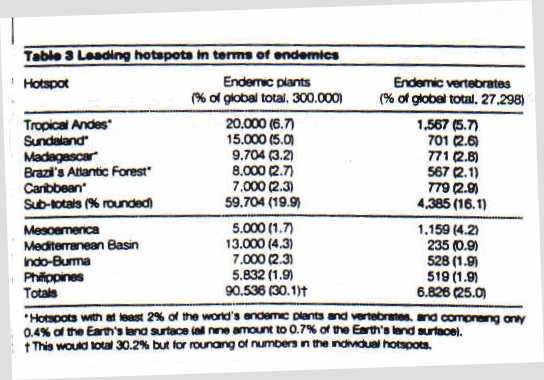
What are the hotspots?
The leading ones are:
·
Tropical Andes
·
Sundaland (Indonesia)
·
Madagascar,
·
Brazil's
Atlantic forest
·
Caribbean
islands.
Each contains at least 2% of
total plant biodiversity, or a total of 20% of all plants and 16% of all
mammals. These regions are also among the world's
most impacted by human activities.
See
Myers et al. (2000) Table 3 - leading hotspots
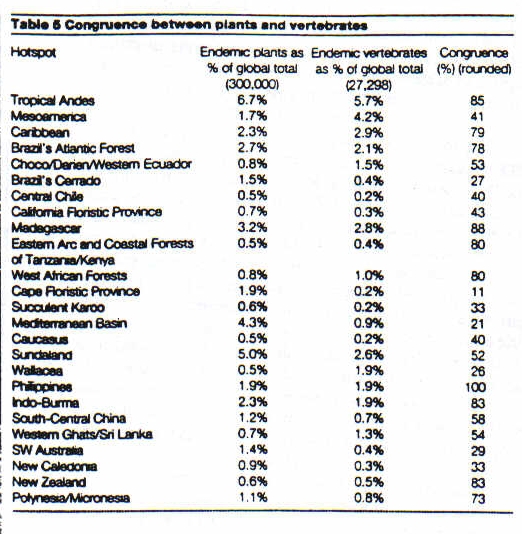
There appeared to be pretty
good correspondence between areas that were rich in plants and those rich in
vertebrates. For example, areas rich in both plants and vertebrates included
the Philippines and various northern African habitats, and the tropical
Andes. Low correspondence was found for The Cape region of South Africa
(rich only in plants - fynbos), and SW Australia
(rich in Acacia and Eucalyptus plants).
See
Myers et al. Table 5 - congruence
Overall, judging by a
variety of biota (not just plants), Madagascar, the
Philippines and Indonesia were the richest regions on the planet.
In
a follow-up paper, also published in Nature, Cincotta
et al. (2000) showed that by 1995, more than 1.1 billion people lived in the 25
hotspots identified by Myers et al. (2000).
This value was about 20% of the world’s population (12% of the
world’s surface area) at that time.
Population growth rate in the hotspots was 1.8% per year, much higher
than the rate for the rest of the world as a whole (1.3% per year), and above
that even of developing countries (1.6% per year). Human demography is thus likely to cause
substantial environmental impact in these biodiversity hotspot countries.
Obviously the type of stress
applied by humans will differ from place to place. In the USA, the major
stresses imperiling species are, in order:
·
habitat
destruction and modification,
·
nonindigenous
species,
·
pollution,
·
overexploitation
·
and diseases (Wilcove et al. 1998).
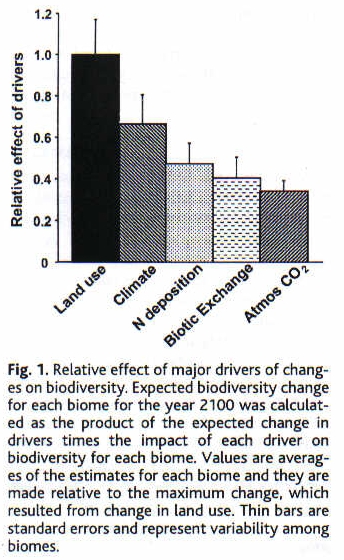
Sala et
al. (2000) examined global ecosystems and the stresses expected to impact them
over the next 100 years. Overall changes to biodiversity are expected to be led
by changes in land use, climate change, nitrogen deposition (enrichment),
species invasions, and increased carbon dioxide in the atmosphere.
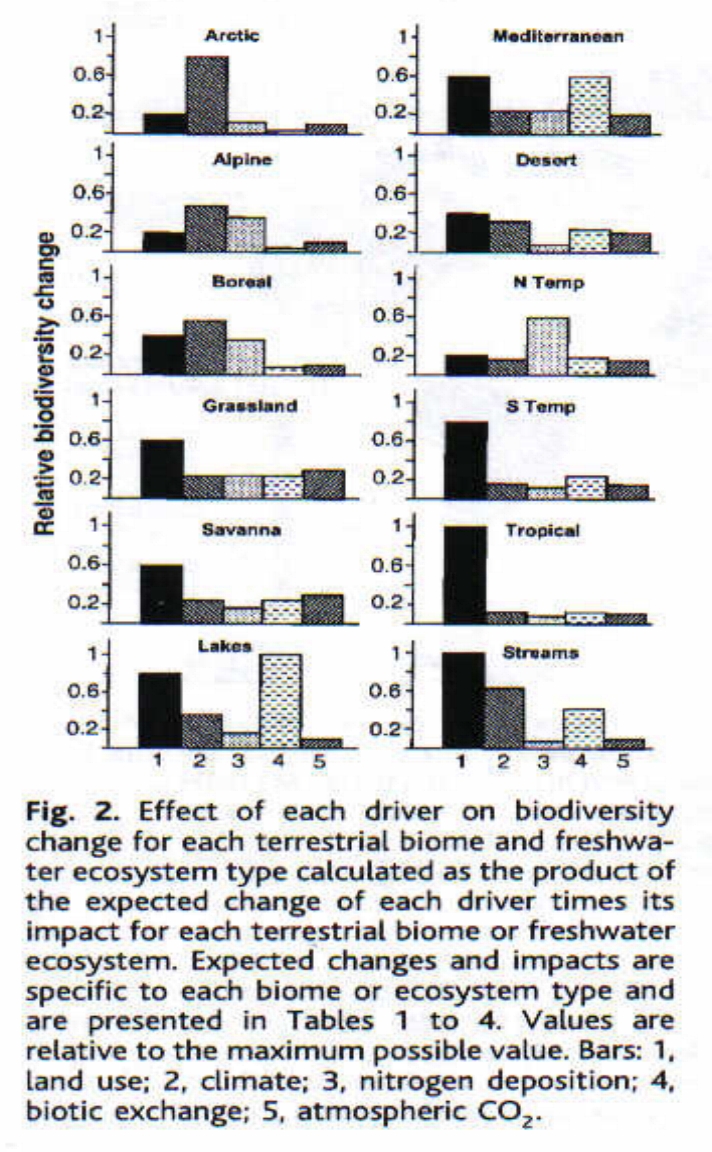
However, the importance of different mechanisms is expected to vary
tremendously across biome types. In
streams, tropical forests and southern temperate forests land use will be the
major factor effecting change. In arctic and alpine ecosystems and boreal
forests, climate change will be the leading factor. In northern temperate
forests, nitrogen deposition will be most important. Lakes and
Mediterranean regions will be most impacted by species invasions.
See Sala et al. (2000) overall effects (Figure 1) and biome-specific cases (Figure 2).
Although
North America, and Canada in particular, tends to have relatively low
biodiversity levels and relatively low levels of habitat destruction/population
growth, conservation of endangered and at risk species is still a
concern. The Ontario government has created a web site that lists all
endangered, threatened, vulnerable, extirpated, and extinct species in the
province. (see Endangered Species in Ontario). Check out the
area of southern deciduous forest to see what is endangered in our area.
Hardin, G. 1968. The tragedy of the commons. Science 162:1243-1248.
Meffe, G.K. and R.C. Carroll. 1997. Principles of Conservation
Biology. Sinauer, Sunderland, MA.
Postel, S.L., G.C. Daily, P.R. Ehrlich. 1996. Human
appropriation of renewable fresh water. Science
271:785-788.