Design of
Natural Reserves
Reading:
pp. 213, 308, 326-327
Shafer, C.L. 2001.
Inter-reserve distance. Biol. Conserv. 100:215-227.
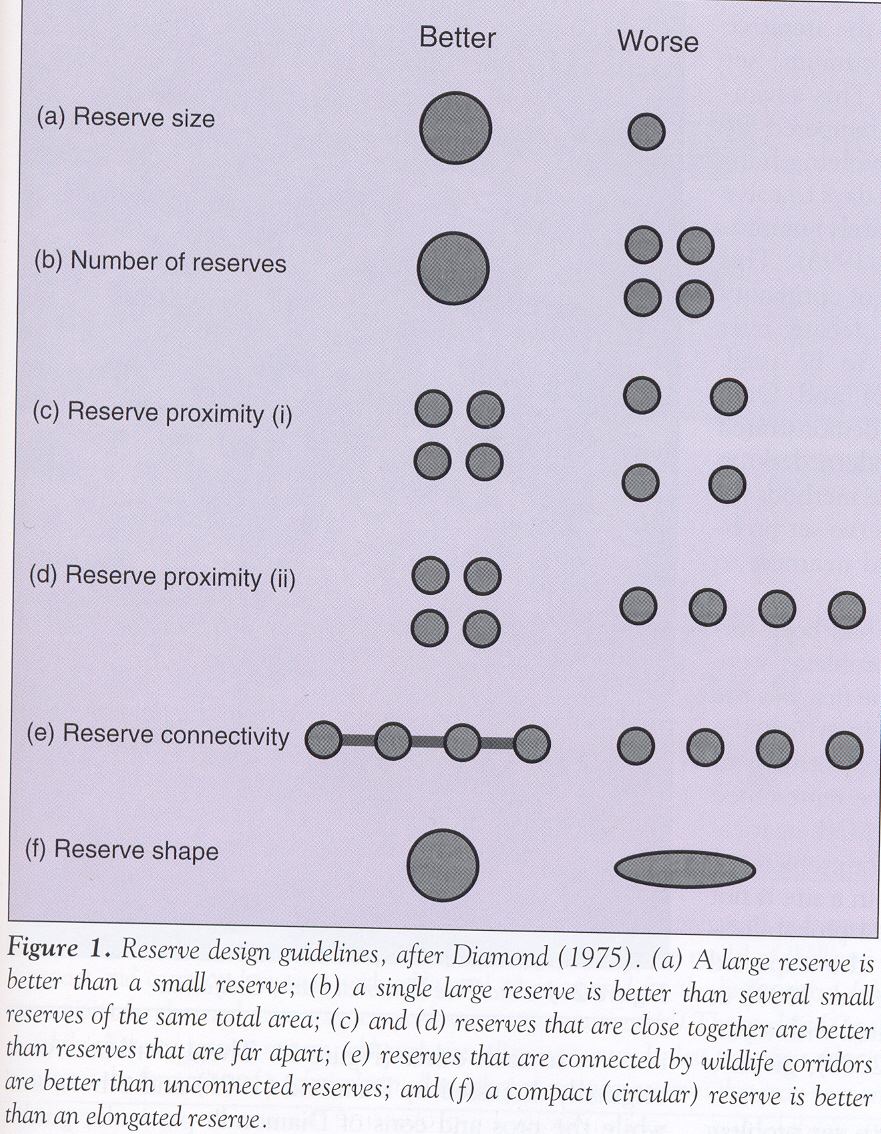
Jared Diamond applied the underlying principles of
island biogeography to optimizing the design of nature preserves. Some of the
ideas about design will be obvious, some are controversial, and some are based
on the rules he defined. Diamond’s basic rules can be summarized in Williams et
al’s graphs.
Rules for Reserve Design
A. The larger the reserve, the better. There will be more
species at equilibrium in a larger reserve, and a lower extinction rate. The
species most likely to be endangered by isolation in limited preserves are the
most 'K-type' species. These species typically have smaller carrying capacities
and lower potential growth rates (r). They are, therefore, more vulnerable to
demographic extinction, due to an inability to recover from chance declines
from already small population sizes. The larger park, by favoring numerically
greater equilibrium population sizes, may best insulate endangered species from
chance demographic extinction due to small population size. The larger park may
also protect species with large habitat requirements and minimize edge effects.
B. One large preserve
is better than a number of smaller reserves with the same total area. Again,
if we consider the species most likely to be endangered by restriction to the
reserve(s), they are likely to be those with the poorest dispersal
capabilities, or those with the largest home range requirements. If dispersal
is the problem, these are species unlikely to be rescued by renewed immigration
from nearby 'islands' separated even by relatively short path length barriers.
From this point of view, even a larger total area of small reserves may be
inferior. The same conclusion is reached for species whose small populations
result from being high in the trophic structure. These species have minimum
home range requirements which may not be met by small reserves, so that even
though they can move between reserves, they cannot maintain minimum viable
populations in any of them. This view of the situation is embodied in rule A of
the figure. On the other hand, unique habitats and biotas with specific
environmental requirements may be best met by preserving multiple isolated
areas. The effects of natural catastrophes need to be considered. Many
conservation biogeographers claim that a single large reserve is dangerous
(putting all your eggs in one basket). Obvious reasons include both biotic - epidemiological - and abiotic hazards. A
disease or a forest fire could wipe out the total population in a single large
preserve, but is unlikely to spread among a number of smaller, separate ones.
Others claim that, in a large enough area, some will always find a refuge.
Species unique to a single small reserve wouldn't fare so well, and uniqueness
is one of the grounds for favoring multiple small reserves over fewer large
ones. Other factors may also become important considerations. For example:
Population management considerations. Area is not the
sufficient answer for species whose populations fluctuate widely in size. In that case, the larger the area the larger the management
problem. This is one of the problems presently being faced by African
big game parks. Elephants seem to go through a 50 year population 'cycle', and
during at least part of it are remarkably capricious and destructive. There are
many other management concerns which need to be taken into account in making
practical decisions about the size and placement of reserves. In tropical
forest areas ease of access is a consideration. If there are roads and/or major
riverways which permit access to the reserve, it is more likely to be subject
to poaching, logging, or other negative impacts.
A separate
management factor is the tendency for a large preserve to be 'nibbled' at the
edges for alternative uses in the belief that 'there's still plenty left'. On
the other hand, smaller parks may be more affected by even unintentional
outside 'pollution'. Finally, there are frequently edge effects. Multiple small
reserves have relatively less core and more edge. This is one of the key
impacts of fragmentation. Some species require the insulation and relative
stability of core areas, others are more successful in
marginal habitats.
If the same
total area can be preserved, and we discount disaster scenarios, is it clear
that more species are accommodated in a single large versus several small reserves?
That belief was questioned by Simberloff, in what became known as the SLOSS
(Single Large or Several Small) controversy (Simberloff and Abele 1976, 1982).
It should be apparent that if several small reserves duplicate the habitat
variation present in the large reserve (or in the other small ones) that
species area curves, which were linearized by log transforming both axes, are
really curvilinear, and a larger number of species is preserved by the single
large preserve. However, if there is habitat heterogeneity among the small
preserves, then the answer is not as clear. Different species may accumulate in
different small preserves, and in sum the total number of species present can
exceed the number in a single large reserve. The kind of reserve favoured
depends on 1) the slope of the species-area curve. The steeper it is the better
the larger reserve; and 2) the number of species shared among smaller reserves.
The larger the shared proportion the better the larger preserve.
Environmental heterogeneity may be important. The species-area curve has
an embedded assumption of homogeneity. In areas which are distinctly
heterogeneous each small reserve may protect a different group of species,
where all could not be protected in any single preserve of reasonable size.
This comment has also been presented in terms of preservation of alternative
guilds which could not stably coexist.
Another
practical criticism is irreversibility. Fragmentation of protected areas may
not be recoverable, ecologically or economically. This may not argue for small reserves,
instead it argues against sacrificing core areas critical to any endangered
species. However, the same development, etc. that has caused fragmentation also
means there has been high habitat loss in many areas, and that only small
reserves are available practically.
If only
small reserves are available should conservation be abandoned? Is the effort
doomed to failure? In many ecosystems, plants particularly may be protected in
small patches. 80% of California's 1700 rare plant species are from three
habitat types available only in small patches: valley grassland, coastal scrub,
and serpentine mixed chaparral. The most diverse patches of tall grass prairie
are almost all very small, in a range around 2 ha. Larger areas tend to be of
low quality and lack rare species. The high quality patches have, for various
reasons, not been grazed, plowed, or otherwise disturbed. They are places like
along railroad rights-of-way or odd corners between agricultural fields. There
is a legislative problem with these kinds of small patches, at least in the
U.S., with reasonably aggressive protection for rare species: the area cut-off
for regulatory protection is 4 ha. Schwartz notes that most Carolina bay
wetlands, as an example of a very diverse, rare community, are less than 4 ha
in area.
All these concerns about size may be moot. Modeling
studies of persistence in parks globally suggest that the largest mammal
species are generally not offered sufficient park area for long term
persistence. Less than 22% of parks around the world will, on a probabilistic
basis, support their largest mammalian carnivores (10-100kg) for a century, and
none of these species are expected to persist for 1000 years (at least in the
parks alone). What holds for a century for carnivores is about right for
herbivores over the 1000 year span.
C. If small reserves are necessary, they should be arranged spatially to maximize immigration rates among reserves. The preferred ways of achieving this end are to position the reserves as closely as possible, e.g. in a hexagonal close array, by protection of smaller, natural area stepping stones between them, or by protecting linking corridors. Species are not likely to go extinct in each of a number of separate preserves simultaneously. This is a basic result of metapopulation theory. Multiple preserves, if spatially arrayed in optimized ways, increase the probabilities of reciprocal inter- or re-colonizations. These arrangements would maximize the probability of 'rescue effects'.
Corridors as means of achieving connectivity bring their own problems. One is simply the size of corridor necessary to achieve the desired goal for many of the larger animals we hope will use them. Based on home range sizes, here is a short table of required corridor widths for different animals. How likely is it that corridors of the larger widths are possible?
There is a modern approach that arises from this. It
is called hierarchical reserve design. Core areas are highly protected,
but surrounding them are buffer habitats with less protection. Core areas may
be connected by corridors. The buffer areas reduce edge effects (supposedly).
It is assumed that close packing of reserves and corridors decrease likelihoods
of extinction. However, there is little evidence about whether corridors or
close packing actually affect demography and the likelihood of survival. There
is evidence that corridors may provide a means of entry for exotic species,
disease, and disturbance.
Another
important concept is the minimum dynamic area. If smaller reserves are
necessary, a minimum size should be an area that accommodates a complete
disturbance regime, i.e. includes areas at all stages of a disturbance mediated
succession. This might be achieved within a combination of core and buffer
habitat areas. The minimum viable population concept (MVP for short) may
also be important in setting minimum reserve sizes. In most cases studied, the
park areas are far smaller than needed to maintain MVPs.
D. Reserves should be as
nearly circular as possible. Roundness and continuity in
preserves minimize dispersal distances between habitat patches within a
preserve, and thus acts to maintain or rescue populations which may be
fragmented within a reserve. This minimizes what has been called the 'peninsula
effect', which is evident in the reduced diversity of species at the end of
elongated peninsulas, e.g. the diversity of North American mainland rodents in
southern Florida. Peninsulas may perpetuate local extinctions and thus, in an
island biogeographic sense, reduce the effective area of the reserve. Circular
preserves also maximize the core:periphery ratio.
However, at least one recent paper (Kunin 1997) suggests that elongated shapes
may be advantageous, at least for larger reserves.
One of the problems of multiple preserves
not considered above is the truncation of ecological guilds. The same larger
and/or more specialized species within highly integrated guilds may undergo
demographic extinction in each of a number of preserves. Wilson (1975) cites
the case of Hawaiian avifauna. A combination of cultivation of lowland areas
and introduction of disease-vector mosquitoes has caused the extinction of
large birds. Loss of members of an integrated guild may affect remaining
members.
One major area is human impact at the boundaries of
reserves. There are a number of approaches to mix human culture, economics, and
biological concerns. One approach views the boundary as a filter. Management
and enforcement sets the way the filter functions, and expects that it will
function differently in 'pure' reserves than in multiple use reserves (the
hierarchical approach).
If boundaries
are 'leaky', how can the problem be minimized? This
question is particularly important in the tropics, where economics and
government policy limit manpower and enforcement. For example, in Brazil there
are 29 nature reserves (in addition to production (i.e. multiple use) reserves
and large areas set aside for indigenous peoples) in which there are 23 guards
deployed. On average, that means each guard is responsible for 6053 km2, which
can be compared to standards in the U.S. In the U.S. there are 367 nature
reserves covering 326,721 km2, but 4002 guards, so that on average each is
responsible for 82 km2. In practice, only a small fraction of Brazilian
reserves have any guards (31%), so that most reserves have no protection.
Further, the guards do not carry arms or have the power to arrest violators.
So, how can reserves be
designed to minimize damage under those conditions? Peres and Terborgh (1995)
suggest the sitting of reserves to minimize access, and thus damage from
logging or poaching. Most reserves have been set alongside water courses or
roadways to ease access. That, of course, is exactly the wrong approach when
the objective is protection of biodiversity and habitats. Peres and Terborgh
suggest that the maximum distance potential violators are likely to travel into
the interior of a reserve from points of access is about 10km (this is a
different view of 'edge effects'). Very
large fractions of current reserves are accessible according to the 10 km
criterion.
Figure
3 - Percent of preserve area accessible
for the 29 nature reserves in Brazilian Amazonia
So, instead of setting reserves along access routes,
they suggest setting reserves along watershed divides, minimizing access by
navigable rivers, and where roads don't provide access to internal areas. In
the Brazilian rainforest, most access is by navigable rivers. If new reserves
are targeted for headwaters areas, access can be further limited. Defensibility
can be maximized with lower costs. How can a poacher or logger move products
out of a protected area where there are no roads, only navigable rivers? Along the river. A single guard post, with the power of
enforcement, can guard a reserve by being placed at the boundary of the reserve
along the river access. Larger areas may have multiple river accesses, and
would need protection at each access point. Current reserves, however, are
mostly bisected or bordered by navigable rivers. That requires at least two
guard posts, at each edge of the reserve along the river. Another problem,
peculiar to Brazil, is that where reserves are bordered by rivers, there are
frequently settlements, native and otherwise, across the rivers from the
reserves, with no easy way to supervise access from the settlements.
Since there is so little vertical relief in Amazonia,
Peres and Terborgh suggest little loss of protection of species if key reserves
are placed in headwater areas, where river access is limited, as well as
placement at watershed divides. Downstream reserves would also be important,
but to protect specific aquatic and shoreline habitats. The special shoreline
forest types, called varzea and igapo, contain species that would require
separate protection. With all the complexity of mounting a thorough protective
reserve system in Brazilian Amazonia, the costs are surprisingly small. Total
implementation would cost an estimated $524 million dollars, of which more than
80% is the cost of land acquisition, due to the large fraction of lands held privately.
Maintenance costs were estimated at only $29.5 million dollars for the first 5
years of protective management. This cost is extremely moderate in comparison
with costs of management in the U.S. or Canada.
Procedures to maximize the
value and diversity of reserves
There should be obvious ways to select fragments
which remain pristine or nearly so to maximize the number of species which are
protected. However, codifying this fairly apparent goal in a systematic way has
rarely been attempted. To try and provide some rules, collectively an
algorithm, and show you an application of such a procedure, we'll look first at
the rules, then how they worked for Australian wetlands.
Margules et al. (1988) formed a fairly intuitive set
of rules to preserve all plant species observed in a set of wetlands along the
Macleay Valley floodplain, but ones which avoid bias and minimize the number of
fragments protected. The rules are clearly more general, and can be applied to
any taxon or community when they occur scattered among fragments. There are two
approaches: one goes directly for the biological diversity of species, and the
other goes for fragments of different habitat types, protecting all types and
all species, but selecting separately in each habitat type. First, the rules
for direct attack at biological diversity: To begin you need a complete species
list for all fragments being considered for preservation. Once you have the
list, this is the set of rules and the order in which they are applied:
1. Select all fragments
(wetlands in their work) containing species which only occur in single
fragments. This ensures that rare species are included first.
2. Starting with the rarest
species not represented by those fragments already selected, select from among
all fragments on which it occurs, those contributing the maximum number of
additional, previously unrepresented species.
3. Where 2 or more
fragments contribute an equal number of previously unrepresented species,
choose the one which contains the least frequently occurring additional
species, i.e. go for relative rarity of added species in deciding among quantitatively
equal fragments.
4. Where criterion 3
doesn't end up selecting a fragment (2 or more are equal in all comparisons) then,
to avoid subjective bias, choose the first fragment in the list among them.
This system
works. As the figure shows, when you look for single representations of each
species (the 1's on the figure) you end up choosing species rich fragments with
this algorithm. When you want multiple representation of as many species as
possible, then the fragments selected include more typical fragments, below the
'average' for fragment richness only when you want metapopulations with a
number of fragments (3,4,5) including species.
What happens
when you want to include habitat types in your scheme to select fragments. Assuming the fragments include a number of
different habitat types, the rules are fairly similar, but come at the species
preservation problem by first ensuring that each habitat type is included. The
rules then are:
1. Select the fragment from
each habitat type which has the greatest number of species in the taxon used to
develop the strategy. Frequently, this will be plants. If all species are
included using only the most diverse fragment in each habitat type, then stop.
2. Select a 2nd fragment in
each habitat type which adds the most new species. If there are no fragments of
some habitat type which add new species (i.e. all species were included using
only one fragment of this type), skip it. If all species are included, then
stop.
3. Continue selecting additional
fragments in each habitat type not yet fully represented using the criterion of
rule 2 until all species are included.
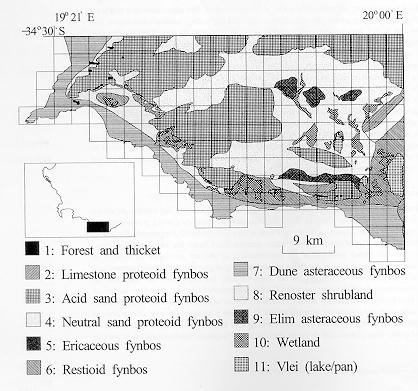
An application of the rules: suggestions for reserve selection in the species-rich, fragmented fynbos of South Africa
The
fynbos are one of the remarkably species rich areas of the world outside the
tropics. The diversity of plants makes this region a significant
"hot-spot". There are a number of sub-designations for types of
fynbos, and the first of the maps that follows divides this area of the
southernmost part of South Africa into those fine scale types. Grid lines
divide the region into 3km by 3km squares, and species lists were developed for
each square.
Fynbos
types and location (Lombard et al. 1997)
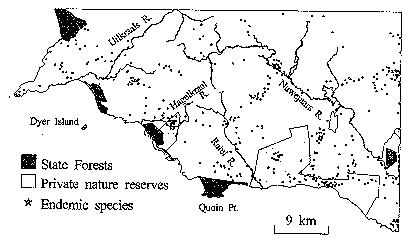
Fynbos vs. state and private reserve locations
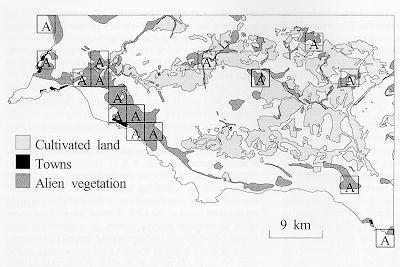
Part of the concern for fynbos is the development of agriculture in the region, the increasing urbanization, and the effects of alien species in the area.
Another
map shows you where towns are located, the areas where alien vegetation has
invaded, and the areas cultivated as different shades of grey. Towns are the
very dark areas, alien vegetation is dark grey, and cultivated lands are pale
grey. White indicates land remaining largely in native vegetation. You can see
that these areas have become fragmented. Special identification of individual
blocks with an A indicates that those 3km x 3km blocks are now comprised of
more than 50% alien (exotic) vegetation.
Location
of towns around fynbos (Lombard et al. 1997)
Development
and agriculture in the region, and occurrence of invasive species (Lombard
et al. 1997)
The third map shows you the regions already under
some form of protection, and where endemic species are located. As the map legend
shows, dark areas are state-owned and protected forest fynbos areas, grey areas
are privately owned nature reserves, with no guarantees of future protection
under the current scheme. The dots (actually tiny stars) are the locations of
endemic fynbos plant species. You can see the dots are not spread uniformly or
randomly over the region. Instead, there are small areas in which a large
number of stars are congregated. Of those small areas in which large numbers of
endemic species are found, only two are in protected sites, and both are
privately held. One is in the extreme south in the narrow band of the large
private reserve along the southern coast. The other is along the Hagelkraal
River. The publicly held lands all protect only one type of fynbos, designated
dune asteraceous fynbos in the first map. As the name suggests, this area is
dominated by Asteraceae (or Compositae), rather than forests.
How can the species endemic to and characteristic of
fynbos be protected? First target levels, in the form of percentages of
remaining vegetation in the various types of fynbos were set. This part of the
decision process might be somewhat arbitrary. Then cells (3km x 3km units) were
selected for inclusion in reserved areas by a set of rules having a remarkable
similarity to the abstract rules set out earlier. They are:
Rule 0 – cells mandated to
be part of reserves. These cells had some unique feature. They are indicated on
maps by an M on a grid cell (image above)
Rule 1 – cells which were
not mandatory, but included unique features.
Rule 2 - select cells with
the next rarest un- or underrepresented feature(s) (species). Next came a rule not seen before, but designed to produce compact
reserves. It is an adjacency rule. Next you should consider cells fully
adjacent to, or diagonally adjacent to cells selected by rules 0-2. If they add
rare or under-represented features, add them to the list.
Remaining rules proceed as in the abstract rule set,
i.e. add cells with the largest areas of the next most under-represented
features, and finally add cells needed to meet target areas that have the
greatest total contribution to targets by adding areas of rare features.
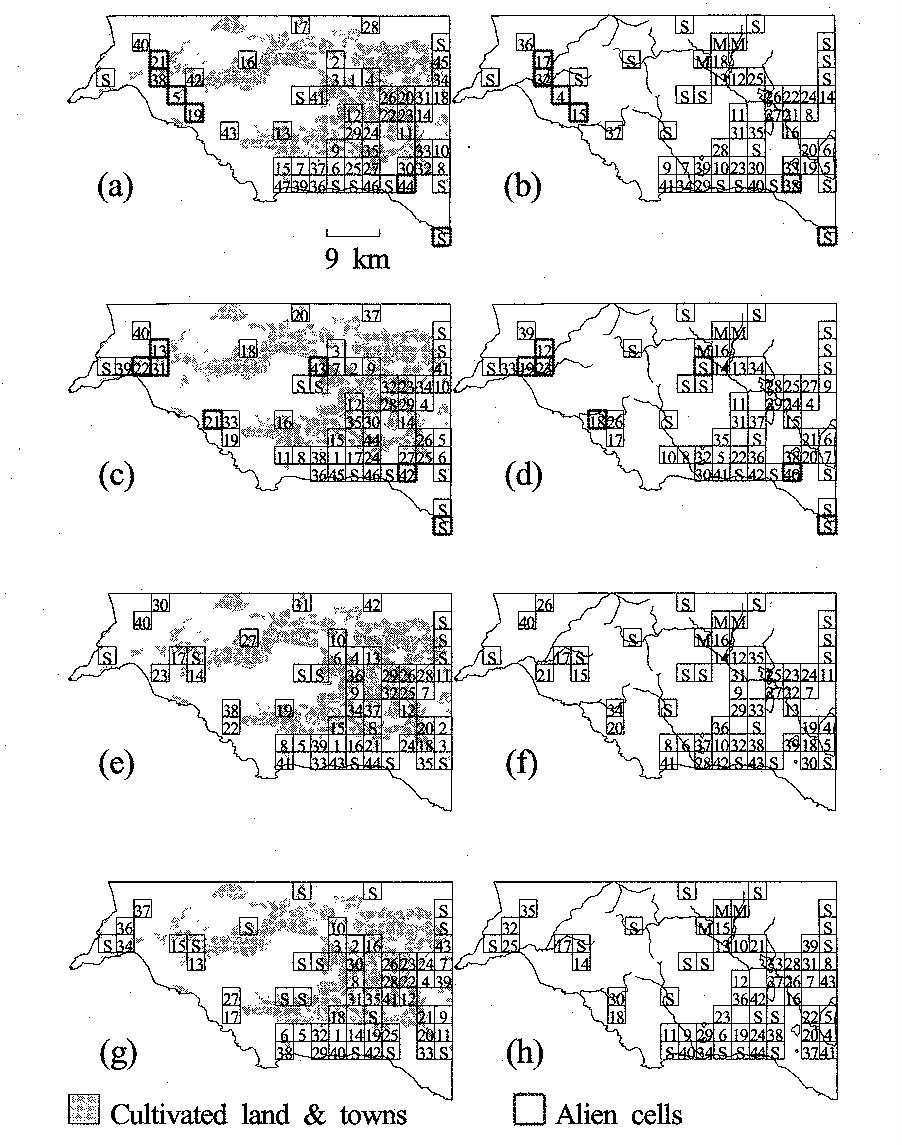
These rules were applied using various algorithms,
and the results show high similarity. The results for 8 different constraints
are shown in the figure. The numbers in the cells represent the order of
selection, meaning low numbers are cells which add unique features, and higher
numbers may add much less in the way of new species, but are important in
reaching desired target representation of each fynbos type. The only new designation here are cells marked with an S. These cell add endemic species to protection, but do not help in
meeting target area representation for each fynbos type.
Regions
suggested for legislative protection, including both public and private lands. Numbers indicate the order in which they
enter the scheme for protection in applying the rules.
Is all this, a real possibility for management of
fynbos in South Africa? Possibly, yes. It has been proposed and is being
developed into legislation that privately held areas may be turned into
'contractual parks'. Apparently this means the title remains in private hands,
and land use is negotiated. The landholder gains the complete management
services of the government, and may profit from ecotourism or related
activities, while the biological resource is fully protected.
A Case Study – Conservation
Priorities in Ecuador. Sierra et al. (2002)
considered risk to possible conservation areas, as well as representation of
different ecosystems in developing a national strategy for Ecuador. The four
factors that ranked areas for inclusion in the national reserve network (NRN)
were: 1) representation (i.e. how well was a given ecosystem type represented
in the already existent reserve network), 2) human pressure (how intensive was
the use or likely use of the type in human activities), 3) habitat loss ( how
badly had this type of ecosystem already been lost to preservation by (largely)
human activity), and 4) species value based on bird species diversity and
presence of rare species. The aim is 10% representation of each ecosystem type
in the NRN. What they found was that the diverse tropical rainforest types were
fairly well represented in the current NRN, but that drier, less diverse were
both poorly represented and most threatened. What you can se in the figure is
that most protected areas are either in the Andes or in the Amazonian
rainforest. The drier areas to the west are virtually unprotected, and yet the
northern coast, called Choco, and the western Andes
contain a variety of what were identified as priority ecosystems. This is a
real application of prioritization tools, in that the paper listed in the
readings was the major part of a report prepared for the Ministry of the
Environment for Ecuador.
Map
5 – a map of Ecuador showing the separate
ecoregions and indicating areas in the current NRN
A Case Study - Ecosystems
in the Inland Northwest of the U.S. A useful approach is suggested
by Della Sala et al. (1996) for forests of the inland northwest of the United
States. The area they are interested in is between the eastern slopes of the
Cascade Mountains in Washington and Oregon and the continental divide in Idaho
and Montana. This area is continuous with the Kootenay region of southern
British Columbia. The area includes a variety of ecosystem types, essentially
all of which have been endangered by logging and associated commercial
activity. The degree of destruction estimated for these ecosystems is so
surprisingly severe that inclusion of a table should be interesting.
|
>99%
converted to agriculture, some places now exotic annuals |
|
This area is obviously in critical condition. The authors
take a long term view. First, the focus is not on protecting rare species or
specific community types. Instead, the objective is both protecting
biodiversity and maintaining natural evolutionary and ecological processes. It
is obvious that this long term goal can only be achieved if further conversion
of remaining natural areas to intensive harvesting (or other human use) is
prevented. Once key core areas are identified, there are four stages to the
conservation process they envision.
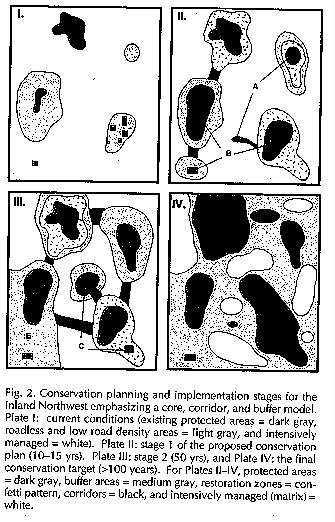
Figure
6 shows the four phases.
Phase I - this is the current
condition. White areas are under intensive management for commodity production
(agriculture, silviculture mostly). Some areas are currently protected in National
parks, wilderness areas, or RNAs (reserved natural areas). These are indicated
in dark grey. They are clearly highly fragmented and isolated. The light gray
areas are isolated, roadless, and not currently productive, but are basically
undisturbed. The first phase would determine a map of this sort.
Phase II - the first phase of
conservation. In this phase representative areas are identified as candidate reserves.
Suggested criteria are not much different than already discussed: 1)
representative areas for all major ecosystem types and seral (successional)
stages must be included, including consideration of patch interactions, 2)
concentrated occurrences of rare species should be included, 3) population
centers for wide ranging species (areas of highest density) should be included,
4) full environmental gradients should be included, and 5) reserve sizes should
take into account disturbance regimes to protect populations. There must be
redundancy in reserves for any particular ecosystem type, or other specific
identified component. In the figure, A indicates a new core area, recognized at
this stage, and B indicates areas identified for enlargement and or combination
to form ecologically integrated areas. Areas to undergo restoration are
identified by speckling. Corridors are formed among some patches. This phase is
suggested to take 10-15 years.
Phase III - identifies a few new
protected areas as a result of ongoing monitoring and research. They are
labelled C. D indicates an area
restoration has been completed; other restorations are identified and/or
continue. Some corridors are no longer necessary (E) as conservation management
proceeds. Note that there is still a significant fraction of the area managed
for commodity production. This phase should take about 50 years to complete.
Phase IV - This is the completed system. In it disturbances like fire would be, as much as possible, uncontrolled, since the system fully represents all seral stages and ecosystem types. Managed areas (the large fraction which is medium grey) are not unproductive, but high intensity harvesting and rapid growth cycles are prevented. In these areas small local sawmills could harvest timber, for example, with long growth-harvest cycles and without large area clearcuts. It would take decades to get to this stage, but once achieved it is self-sustaining. The approximate proportions of the area are: 25% under strict protection, 50% in buffer (limits on utilization, with protection or wildlife, rare species, etc.) and 25% in development (intense commodity production). Studies necessary to pursue this approach are going on in the Inland Northwest; they mostly fall into a category called GAP studies, but are separate in the four states. This approach is not unique and distinct, but does incorporate much of the approaches indicated above and, importantly, takes a clear, long-term approach.
Finally, if a species-specific approach is used to
construct reserves, consideration must be given to specific aspects of the
species' life history, behaviour and ecology. For example, corridors have been
suggested as a means connecting suitable habitats in a larger 'sea' of
unsuitable or less suitable area. Ideally, the corridors will connect
populations separated by inhospitable habitat, resulting in greater overall
population stability. The corridors themselves provide habitat patches in
addition to its movement function (Rosenberg et al. 1997). Corridors could
prove beneficial if they increase the probability of successful movement within
the home range of an individual, or if they increase the movement of
individuals among sub- populations through dispersal of young produced in the
corridor (Rosenberg et al. 1997). However, corridors may present their own
problems (e.g. predators waiting in ambush). Based on habitat suitability
criteria and observed flight patterns, Schultz (1998) noted that 'stepping
stone' habitats would provide the Fender's Blue butterfly with better survival
options than if reserves were designed with corridors between suitable (lupine)
patches. Thus, knowledge of the species biological characteristics may help
determine the type of reserve to establish, and whether corridors or stepping
stones are advisable. Simberloff has been rather critical of the bandwagon
tendency of conservation biologists to adopt corridor policies. Many species
under consideration would benefit from corridor concepts because their
populations exist as a network of metapopulations, which would benefit from
occasional rescues. However, other populations do not exist as metapopulations,
and benefits of corridors may be absent (see Mann and Plummer 1995). Also,
corridors can be expensive to acquire, and the money might be better spent on
'stepping stone' habitat patches. Beier and Noss (1998) reviewed whether
corridors are effective management tools. Only 12 of 32 studies reviewed
provided persuasive evidence in favour of corridors, though many of the studies
reviewed had poor designs that limited assessments of corridor effectiveness.
Among the best designed studies, they found strong support for the utility of
corridors.
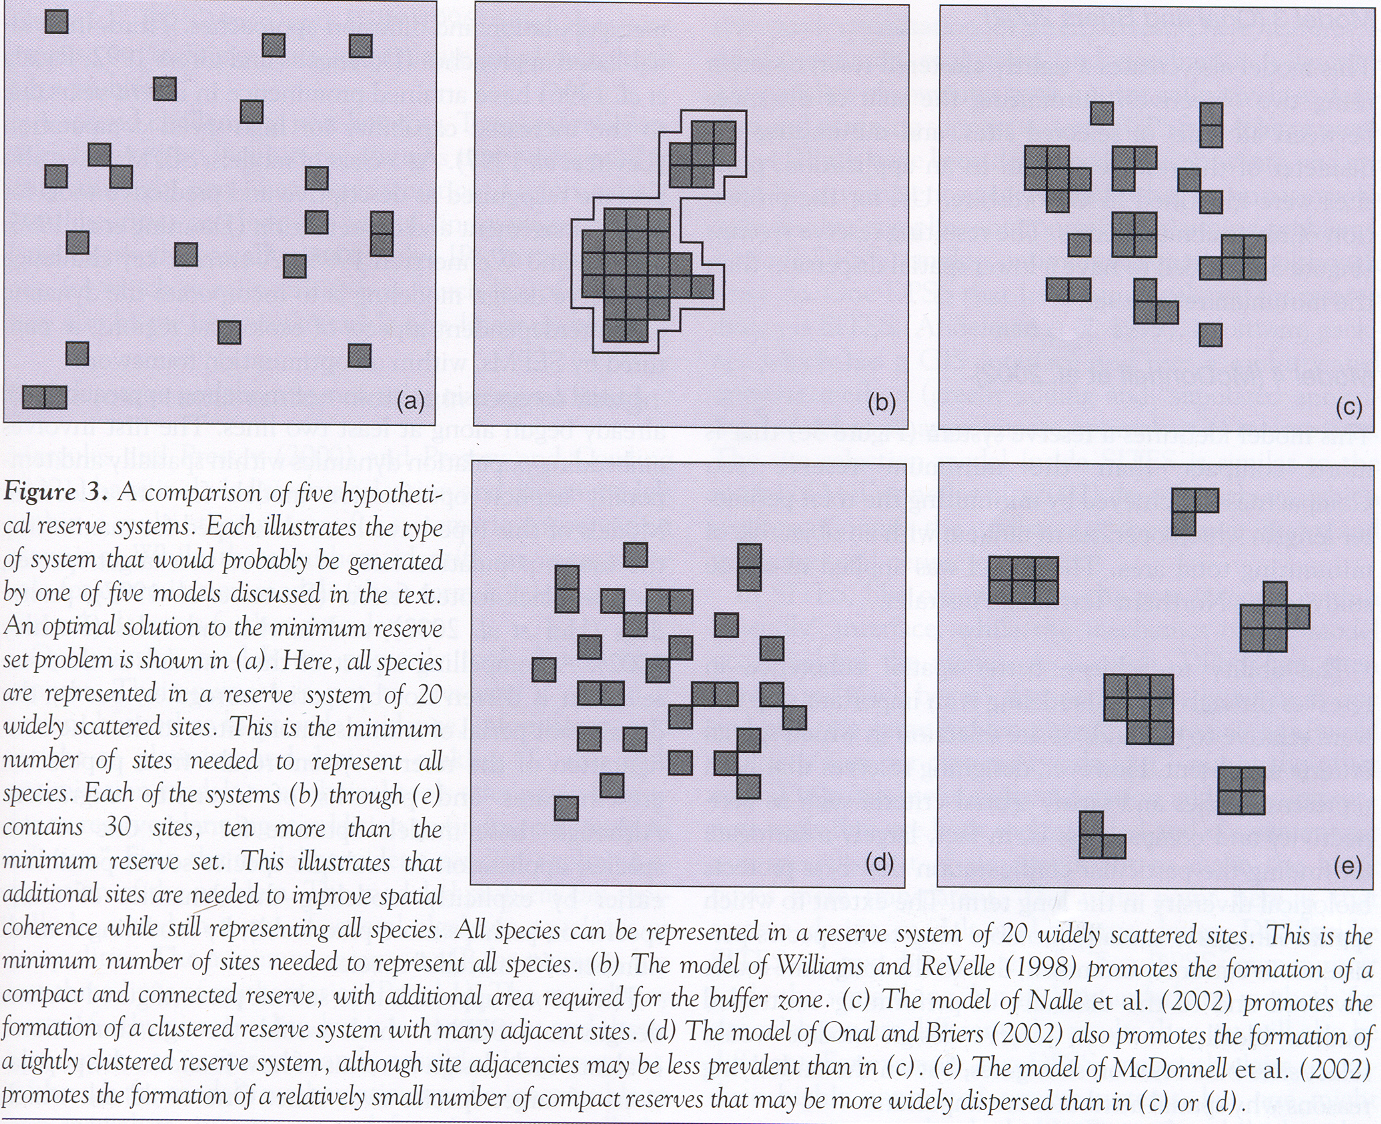
Synthesis of Modern Reserve Design Models:
A number of reserve design approaches were summarized
by Williams et al. (2004) based upon different objectives. These 4 approaches can be shown graphically
(below) and described:
1) Identify a reserve core
that contains all species, then add buffer around it, minimizing total cost of
land to acquire; may promote connectivity and compactness of the reserve (image
b in below figure).
2) Highly connected and
tightly clustered set of mini-reserves, in which the summed distances between
selected pairs is minimized and connectivity achieved by attempting to select
adjacent pairs of cells (image c in below figure).
3) Tight clustering
achieved by minimizing the summed distances between selected pairs AND
minimizing the total diameter of the reserve (image d in below figure).
4) Compactness is achieved
by minimizing total perimeter length (image e in below figure).
Beier, O. and R.F. Noss. 1998. Do habitat corridors provide connectivity. Conservation Biology 12:1241-1252.
Cumming, S.G., P.J. Burton and B. Klinkenburg.
1996. Boreal mixed forests may have no "representative" areas: some
implications for reserve design. Ecography 19:162-180.
Della Sala, D.A., J.R. Strittholt, R.F. Noss and D.M. Olson. 1996. A critical role for core reserves in managing
Inland Northwest landscapes for natural resources and biodiversity. Wildlife Society Bulletin 24:209-221.
Goodman, D. 1987. The demography of chance
extinction, in: Viable populations for conservation. M. Soulé, ed. Cambridge U.
Press. p. 11-34.
Lombard, A.T., R.M. Cowling, R.L. Pressey and P.J. Mustart. 1997. Reserve selection in a species-rich and
fragmented landscape on the Agulhas Plain, South
Africa. Conservation Biology
11:1101-1116.
Mann, C.C. and M.L. Plummer.1995. Are wildlife corridors the right path? Science 270:1428-1430.
Peres, C.A. and J.W. Terborgh.
1995. Amazonian nature reserves: an analysis of the defensibility status of
existing conservation units and design criteria for the future. Conservation Biology 9:34-46.
Rodenberg, D.K., B.R. Noon, E.C. Meslow.
1997. Biological corridors: form, function, and efficacy. Bioscience 47:677-687.
Schonewald-Cox, C.M. and J.W. Bayless.
1986. The boundary model: a geographical analysis of design and conservation of
nature reserves. Biological Conservation
38:305-22.
Schultz, C.B. 1998. Dispersal behavior and its
implications for reserve design in a rare Oregon butterfly. Conservation Biology 12:284-292.
Schwartz, M.W. 1999. Choosing the
appropriate scale of reserves for conservation. Annual Review of Ecology and Systematics 30:83-108.
Shafer, C.L. 2001. Inter-reserve distance. Biological Conservation 100:215-227.
Sierra, R., F. Campos and J. Chamberlin.
2002. Assessing biodiversity conservation priorities: ecosystem risk and representativeness in continental Ecuador. Landscape Urban Planning 59:95-110.
Simberloff, D. and L. Abele, 1976. Island biogeographic theory and conservation
practice. Science 191:285-6.
Simberloff, D. and L. Abele, 1982. Refuge design and island biogeographic theory: effects
of fragmentation. American Naturalist
120:41-50.
Williams, J.C., C.S. ReVelle, and S.A. Levin. 2004. Using mathematical optimization models to
design nature reserves. Frontiers in
Ecology and the Environment 2:98-105.
Wilson, E.O. and E.O. Willis. 1975. Applied biogeography. in
Ecology and Evolution of Communities. M.L. Cody and J. M.
Diamond, eds. Harvard Univ. Press, Cambridge, MA. pp.522-536.